page
Taranaki Regional Council Monthly Rainfall and Environmental
Data Report for December 2024
Note: The data presented here are provisional data only and may change as a result of quality control at a later date.
1. Rainfall
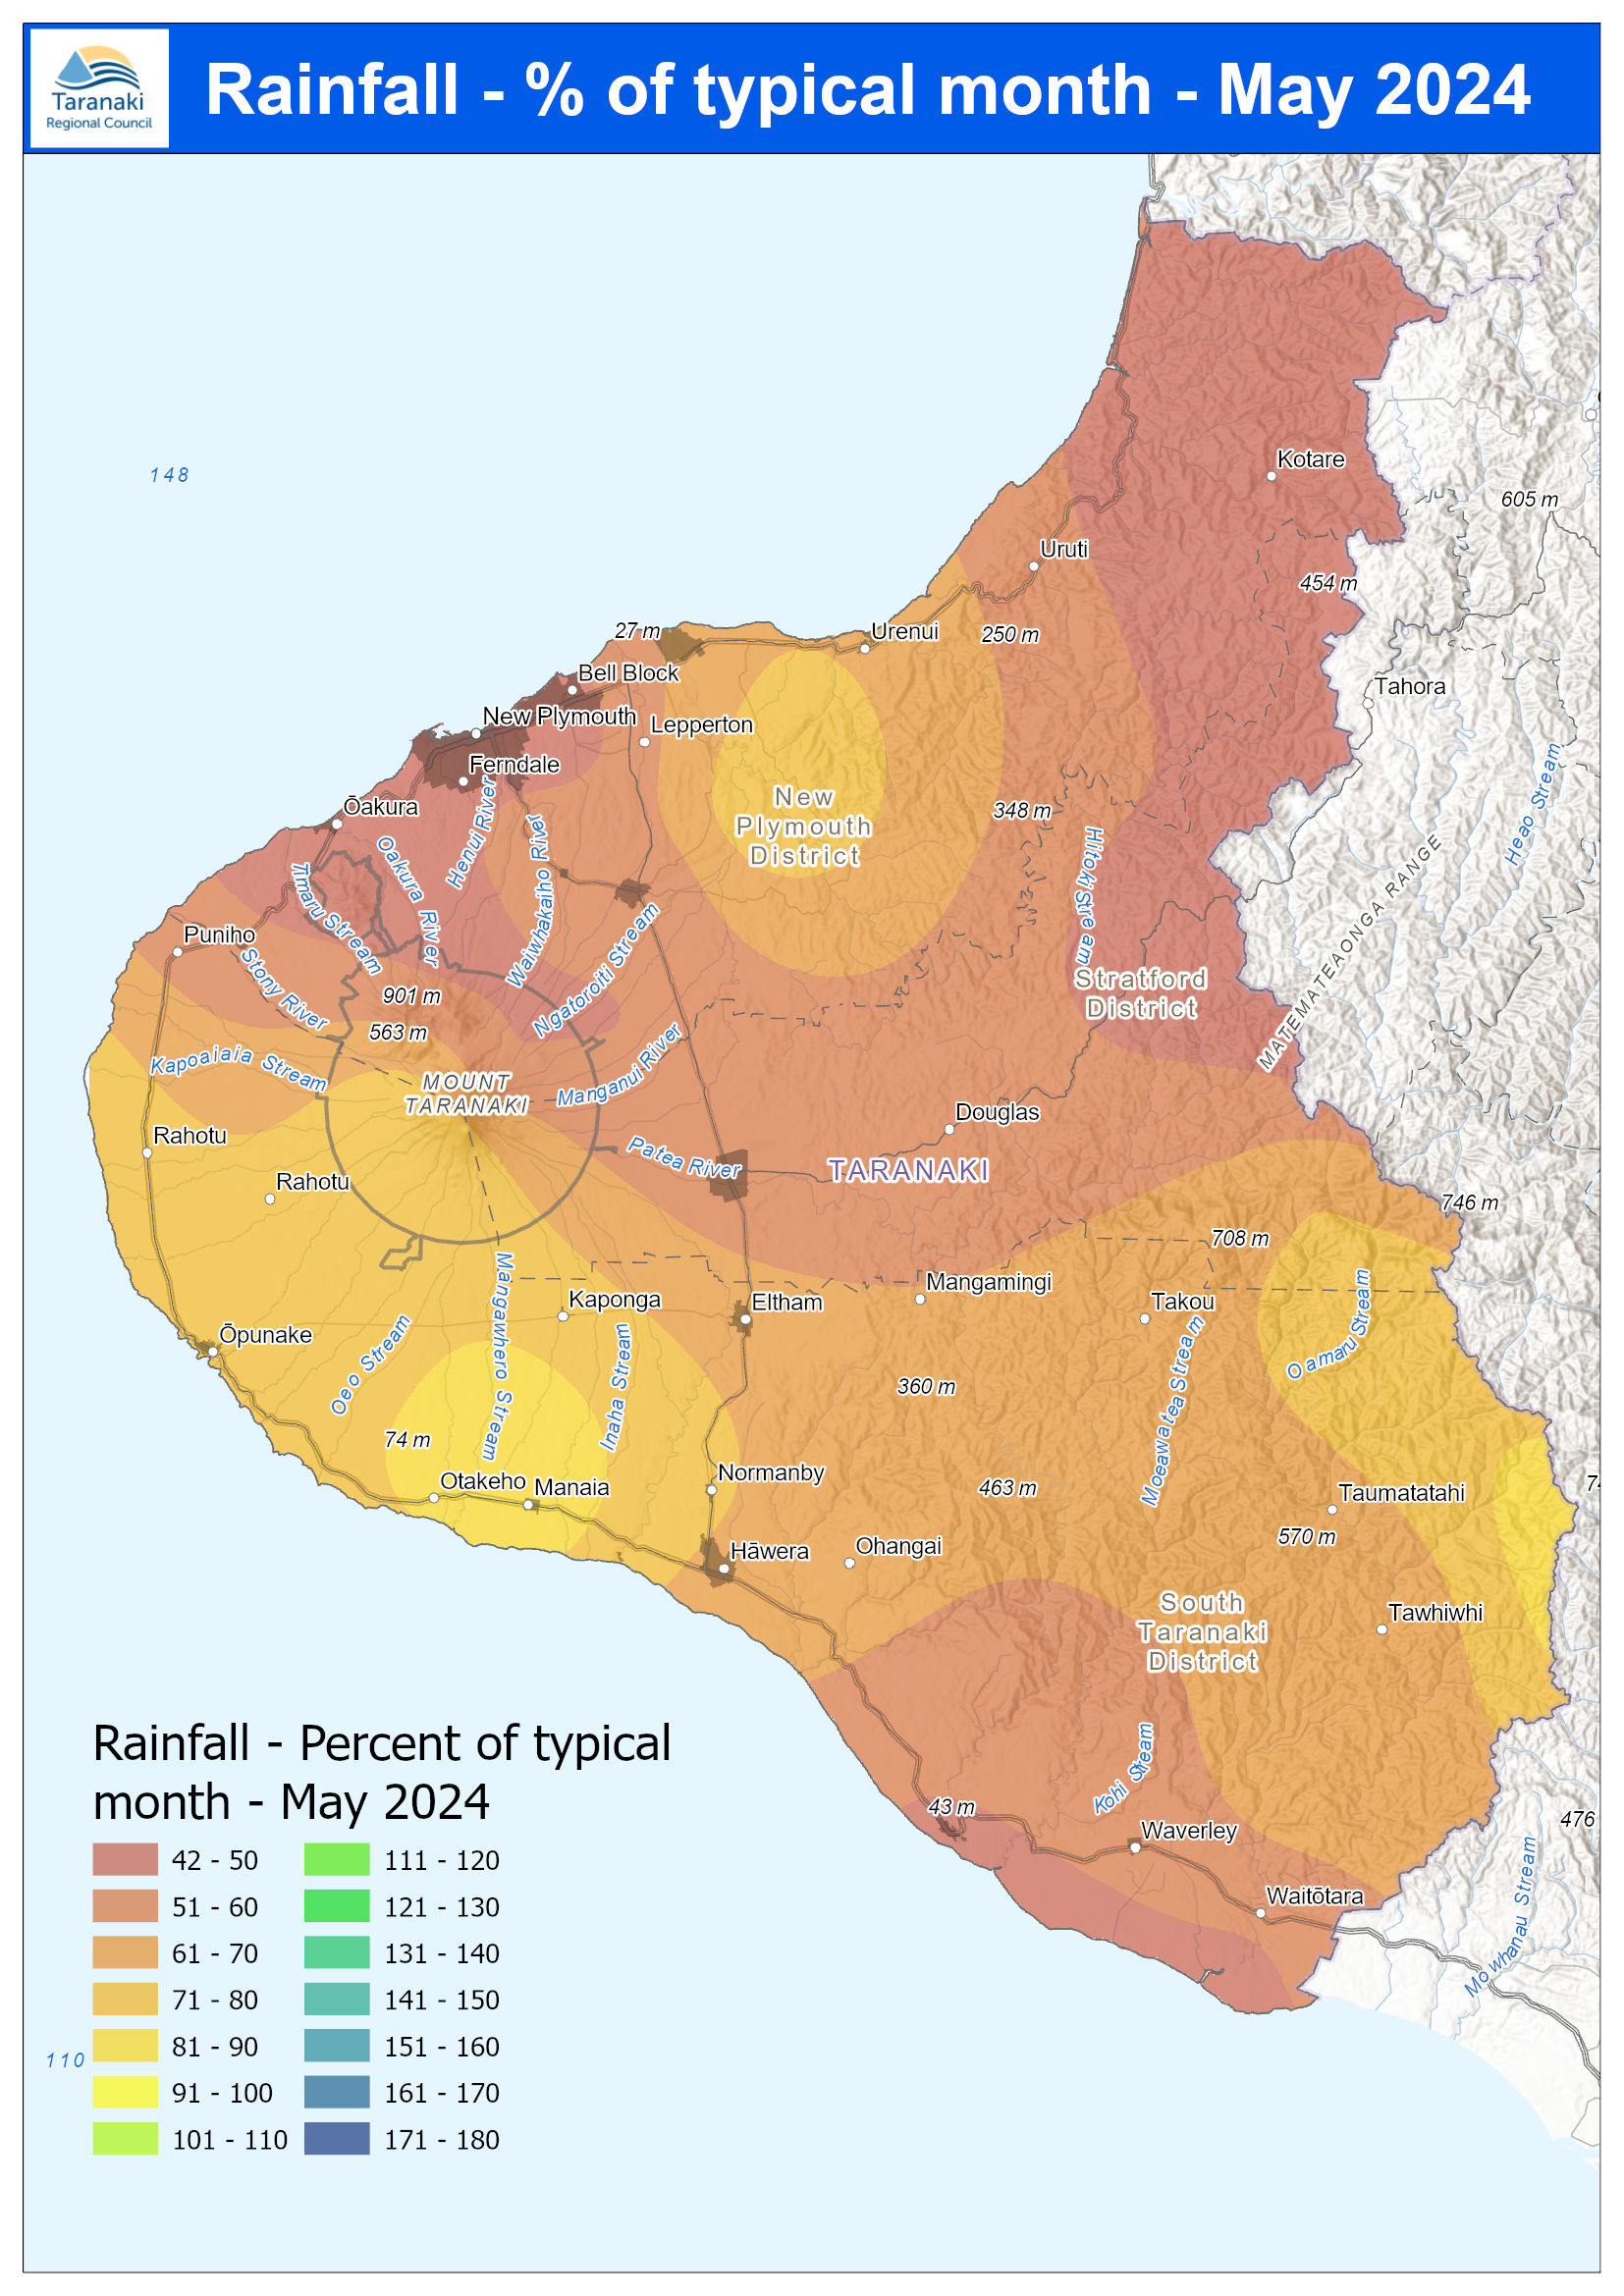
Map 1: December total rainfall (mm) and percentage of long-term mean (colour key).
page
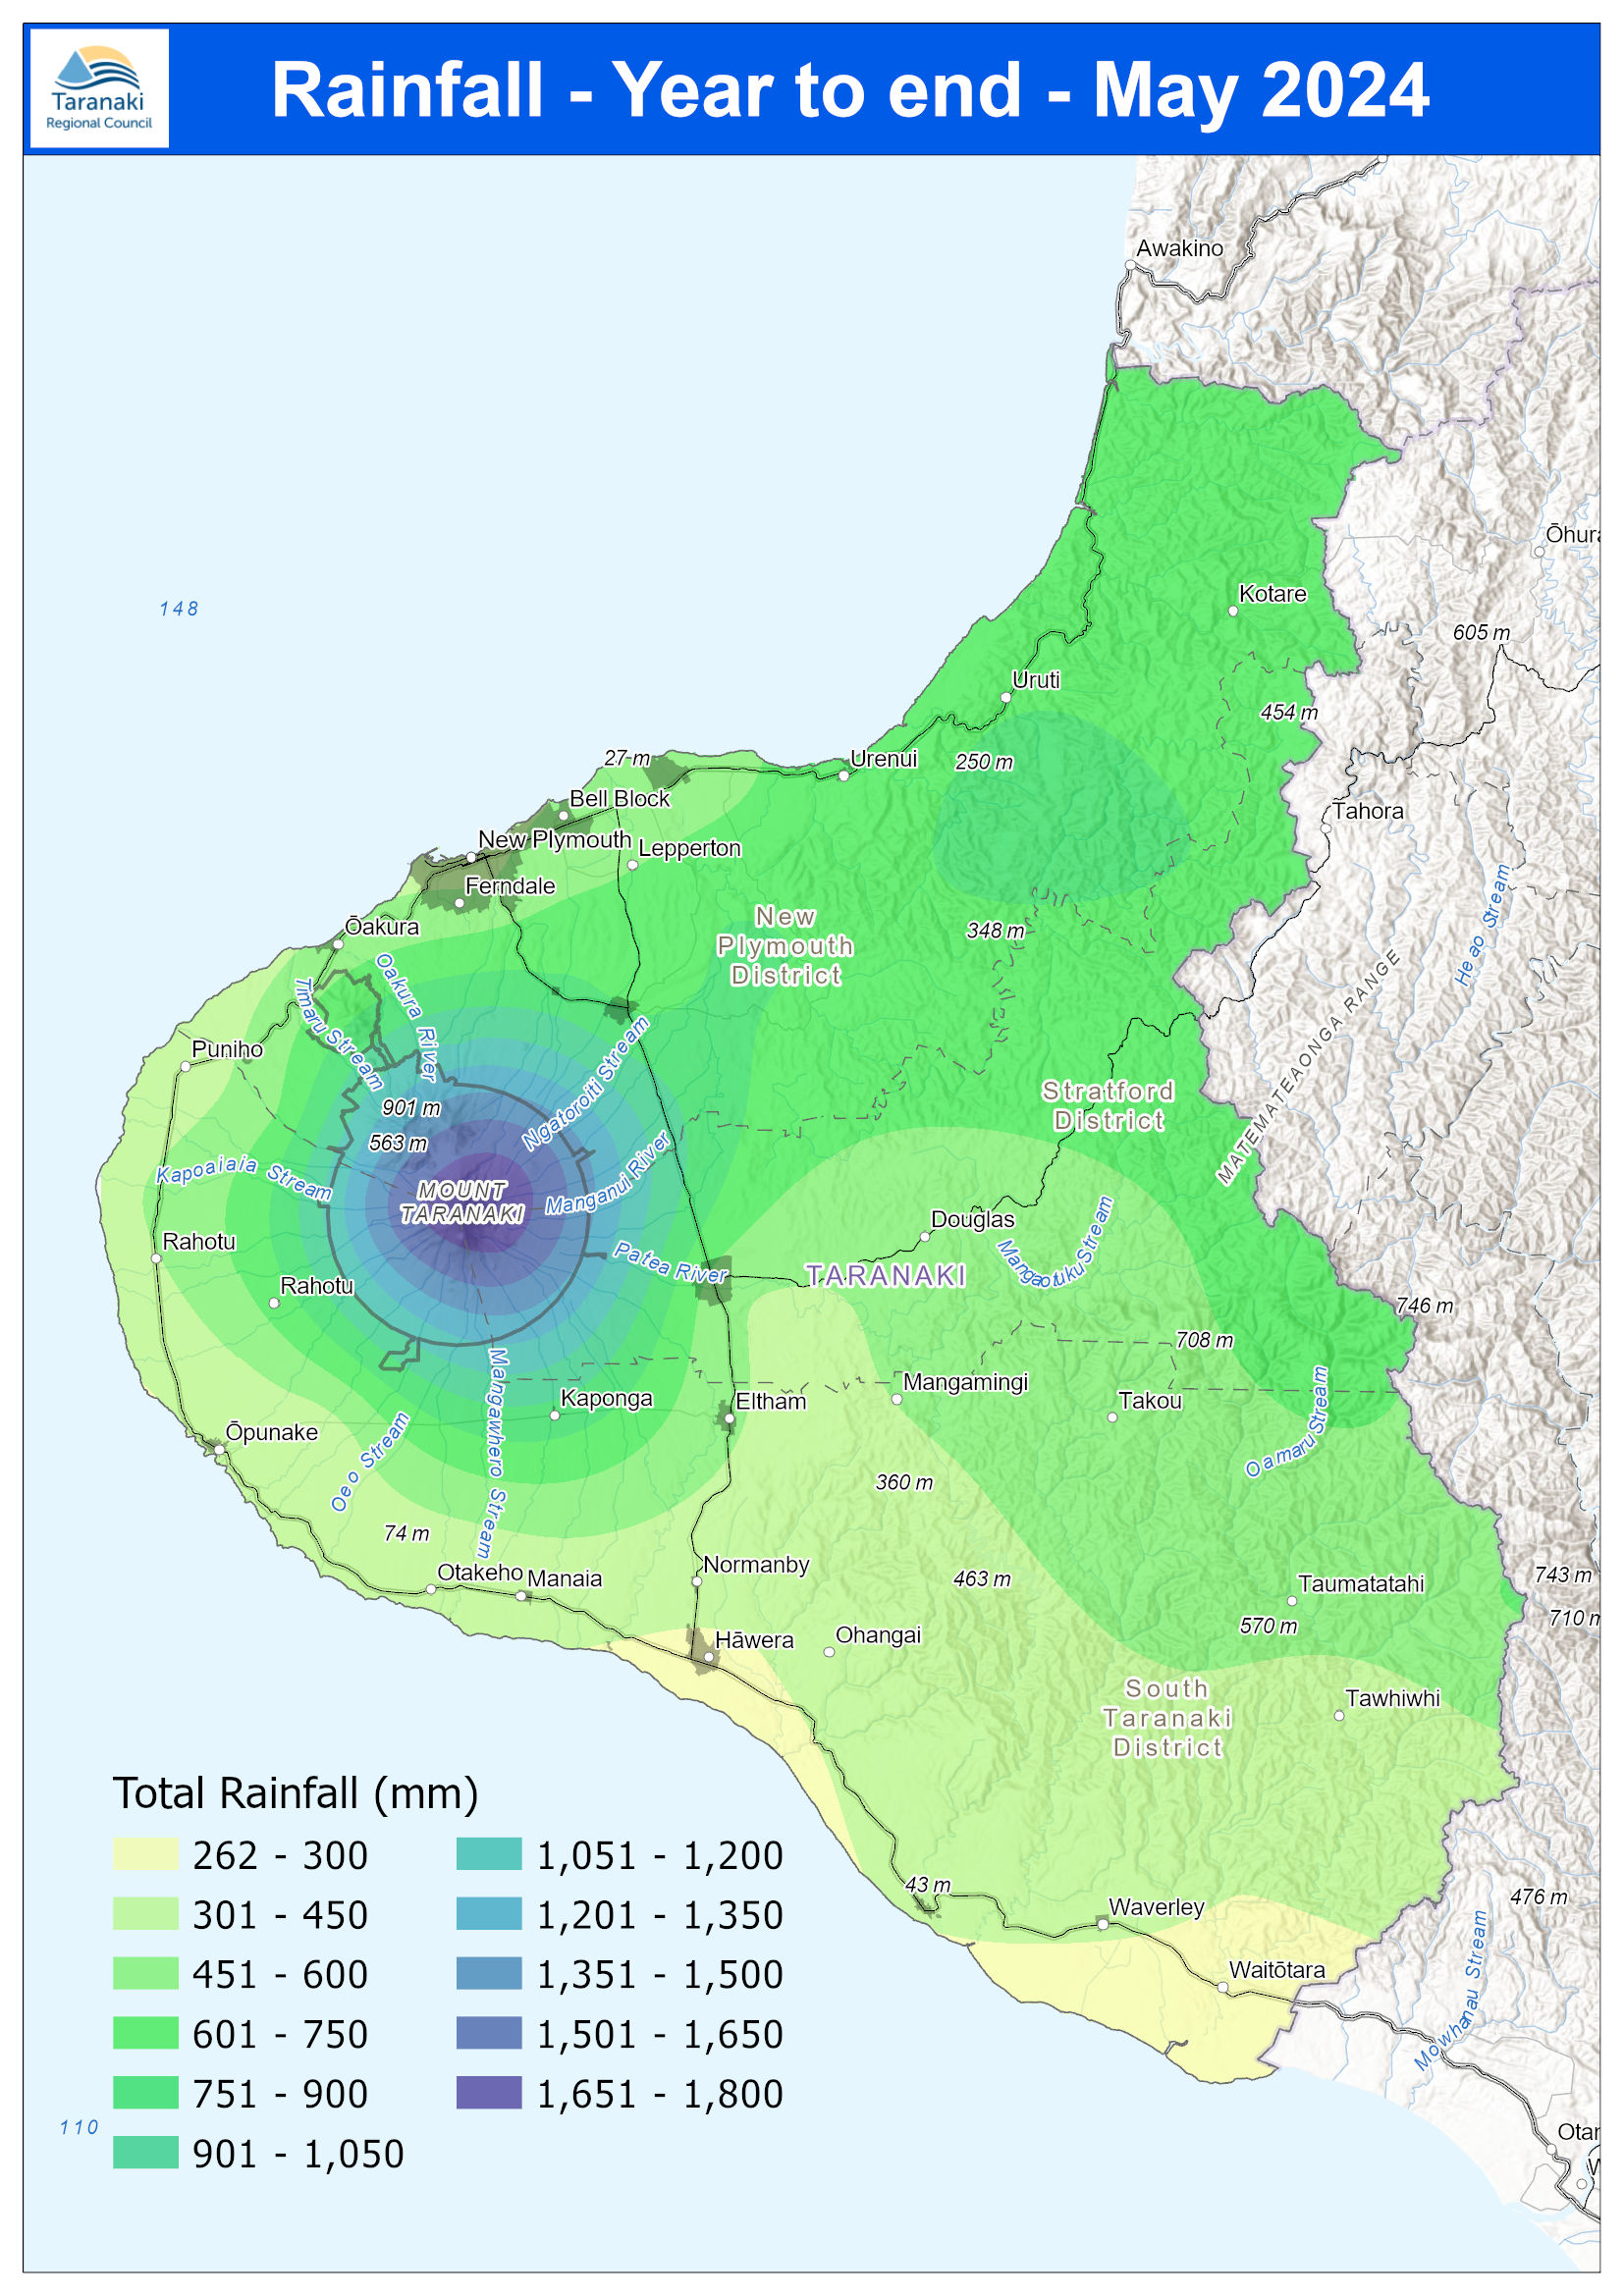
Map 1a. Total rainfall 1 January to end December (mm) and percentage of long-term mean (colour key).
Table 1: Rainfall December and year
page
page
page
April 2021 Rainfall
millimetres
0 - 50
51 - 100
101 - 150
151 - 200
201 - 250
251 - 300
301 - 350
351 - 400
401 - 450
451 - 500
501 - 550
page
April 2021 Year to Date Rainfall
millimetres
0 - 150
151 - 300
301 - 450
451 - 600
601 - 750
751 - 900
901 - 1,050
1,051 - 1,200
1,201 - 1,350
1,351 - 1,500
1,501 - 1,650
1,651 - 1,800
April 2021 rainfall - monitored sites
January-April 2021 rainfall -
page
page
page
March 2021 Rainfall
millimetres
0 - 75
76 - 150
151 - 225
226 - 300
301 - 375
376 - 450
451 - 525
526 - 600
601 - 675
676 - 750
page
March 2021 Year to Date Rainfall
millimetres
0 - 150
151 - 300
301 - 450
451 - 600
601 - 750
751 - 900
901 - 1,050
1,051 - 1,200
1,201 - 1,350
March 2021 rainfall - monitored sites
January-March 2021 rainfall - monitored sites
March 2021 rainfall distribution
page
page
page
page
page
page
February 2021 rainfall - monitored sites
Jan-Feb 2021 rainfall - monitored sites
Summer 2020-2021 rainfall - monitored sites
February 2021 rainfall distribution
Jan-Feb 2021 rainfall distribution
Summer 2020-2021 rainfall distribution
page
page
January 2021 Rainfall
millimetres
VALUE
0 - 50
51 - 75
76 - 100
101 - 125
126 - 150
151 - 175
176 - 200
201 - 225
226 - 250
251 - 275
January 2021 rainfall - monitored sites
January 2021 rainfall distribution
acroform
page
page
page
December 2020 Rainfall
millimetres
0-50
51-100
101-150
151-200
201-250
251-300
301-350
351-400
401-450
451-500
501-550
551-600
601-650
page
December 2020 Year to Date Rainfall
millimetres
0-500
501-1000
1001-1500
1501-2000
2001-2500
2501-3000
3001-3500
3501-4000
4001-4500
4501-5000
5001-5500
5501-6000
6001-6500
December
2020 rainfall - monitored sites
2020 …
page
page
page
page
November 2020 Rainfall
millimetres
0-100
101-200
201-300
301-400
401-500
501-600
601-700
701-800
801-900
901-1000
1001-1100
page
Spring 2020 Rainfall
millimetres
0-200
201-400
401-600
601-800
801-1000
1001-1200
1201-1400
1401-1600
1601-1800
1801-2000
2001-2200
2201-2400
page
November 2020 Year to Date Rainfall
millimetres
0-300
301-600
601-900
page
page
page
October 2020 Rainfall
millimetres
0-50
51-100
101-150
151-200
201-250
251-300
301-350
351-400
401-450
450-500
501-550
551-600
page
October 2020 Year to Date Rainfall
millimetres
0-400
401-800
801-1200
1201-1600
1601-2000
2001-2400
2401-2800
2801-3200
3201-3600
3601-4000
4001-4400
4401-4800
October 2020 rainfall - monitored sites
January-October 2020 rainfall -