page
Taranaki Regional Council Monthly Rainfall and Environmental
Data Report for August 2024
Note: The data presented here are provisional data only and may change as a result of quality control at a later date.
1. Rainfall
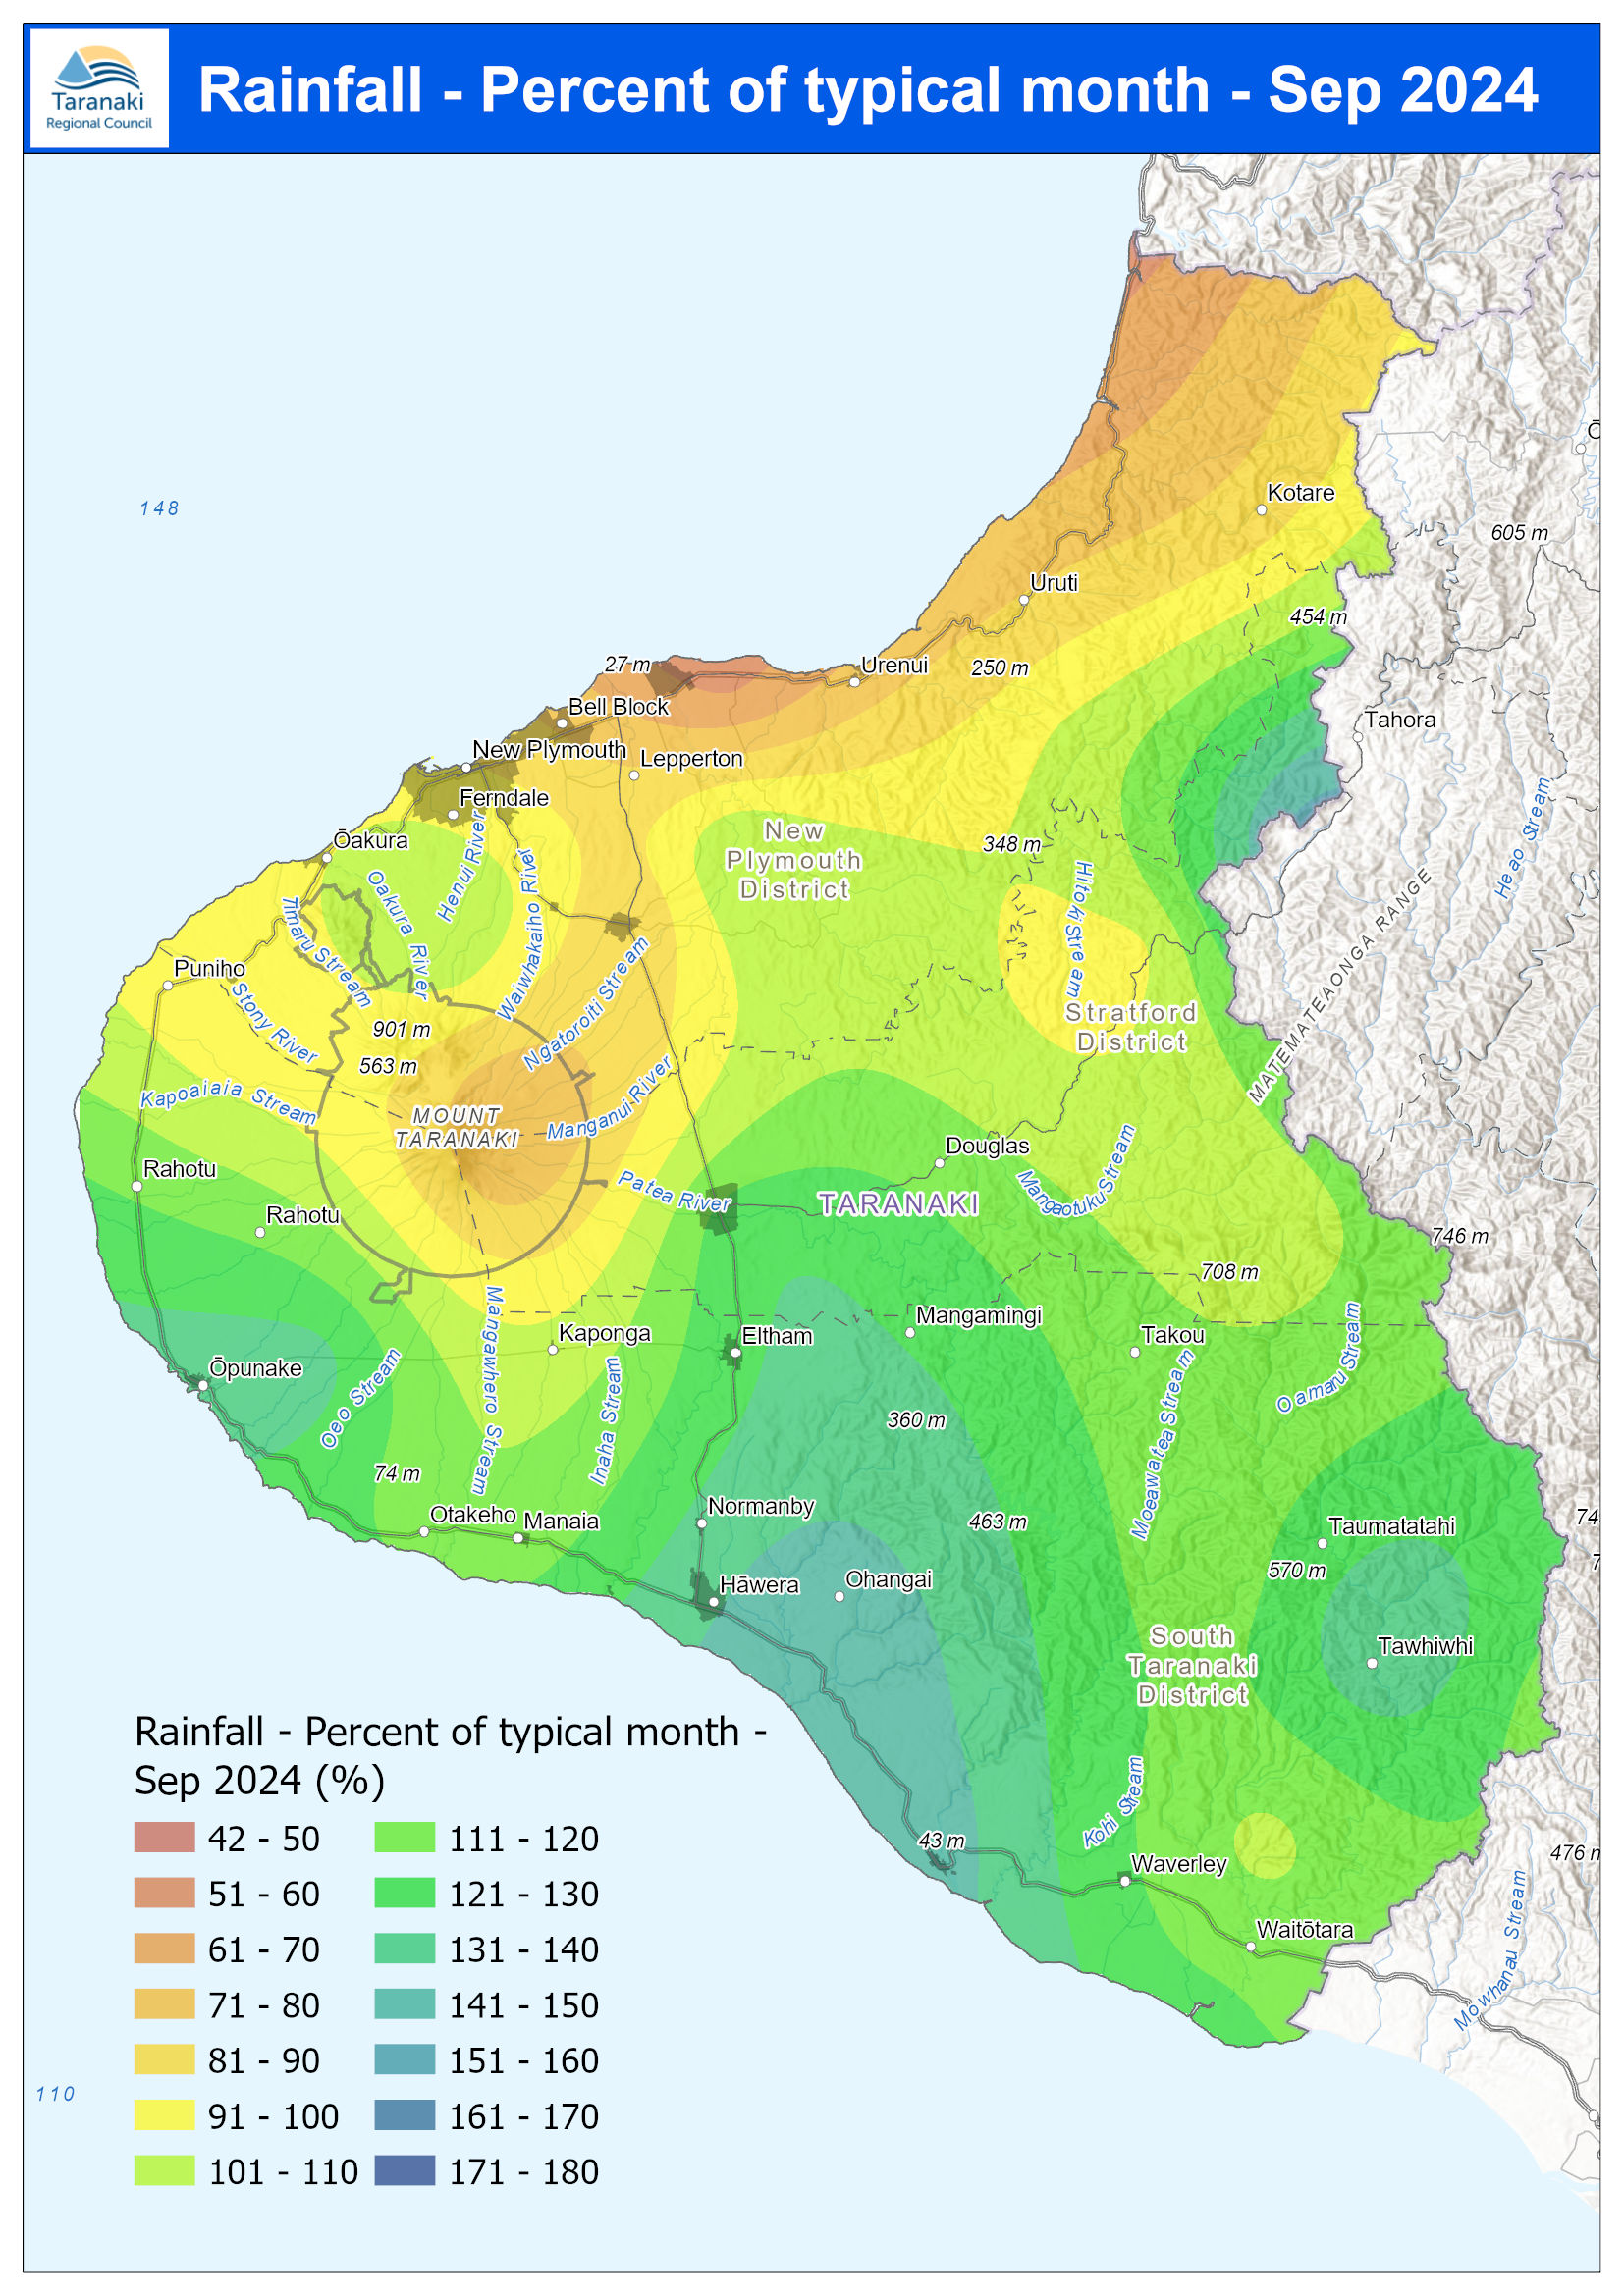
Map 1: August total rainfall (mm) and percentage of long-term mean (colour key).
page
Map 1a. Total rainfall 1 January to end August (mm) and percentage of long-term mean (colour key).
page
Table 1: Rainfall
Table 10 Groundwater quality results GND2484-south 21
Table 11 Groundwater quality results GND2623-west 23
Table 12 2023/24 Groundwater level range and related burial type 25
Table 13 Summary of performance for consent 7882-1.1 34
Table 14 Evaluation of environmental performance over time 34
List of figures
Figure 1 Mangapouri Cemetery location map 3
Figure 2 Burial Plan for first five years of operation 9
Figure 3 Groundwater elevations and rainfall at Egmont Village in 2023/24 27
page
Taranaki Regional Council Monthly Rainfall and Environmental
Data Report for July 2024
Note: The data presented here are provisional data only and may change as a result of quality control at a later date.
1. Rainfall
Map 1: July total rainfall (mm) and percentage of long-term mean (colour key).
page
Map 1a. Total rainfall 1 January to end July (mm) and percentage of long-term mean (colour key).
page
Table 1: Rainfall July and
unlike previously where samples were
collected around high tide in fine weather only. Prolonged and/or heavy rainfall will often result in high
levels of enterococci in the samples as these are washed down flooded streams and rivers from farmland.
This can be exacerbated by a low tide where a sea sample collected from a site near a stream mouth may
contain a high proportion of freshwater.
Water quality at Middleton Bay
Contact recreational bacteriological water quality at Middleton Bay
page
page
page
September 2020 Rainfall
millimetres
VALUE
0-50
51-100
101-150
151-200
201-250
251-300
301-350
351-400
401-450
451-500
501-550
551-600
601-650
651-700
page
September 2020 Year to Date RF
millimetres
0-300
301-600
601-900
901-1200
1201-1500
1501-1800
1801-2100
2101-2400
2401-2700
2701-3000
3001-3300
3301-3600
3601-3900
3901-4200
September 2020 rainfall …
page
page
page
July 2020 Rainfall
millimetres
0 - 50
51 - 100
101 - 150
151 - 200
201 - 250
251 - 300
301 - 350
351 - 400
401 - 450
451 - 500
501 - 550
551 - 600
page
July 2020 Year to Date Rainfall
millimetres
0 - 250
251 - 500
501 - 750
751 - 1000
1001 - 1250
1251 - 1500
1501 - 1750
1751 - 2000
2001 - 2250
2251 - 2500
2501 - 2750
2751 - 3000
July 2020 rainfall - monitored sites
page
page
page
June 2020 Rainfall
millimetres
0 - 75
76 - 150
151- 225
226- 300
301 - 375
376 - 450
451 - 525
526 - 600
601 - 675
676 - 750
751 - 825
826 - 900
page
June 2020 Year to Date Rainfall
millimetres
0 - 150
151 - 300
301 - 450
451 - 600
601 - 750
751 - 900
901 - 1050
1051 - 1200
1201 - 1350
1351 - 1500
1501 - 1650
1651 - 1800
1801 - 1950
1951 - 2100
2101 - 2250
2251 - …
page
Taranaki Regional Council Monthly Rainfall and Environmental
Data Report for June 2024
Note: The data presented here are provisional data only and may change as a result of quality control at a later date.
1. Rainfall
Map 1: June total rainfall (mm) and percentage of long-term mean (colour key).
page
Map 1a. Total rainfall 1 January to end June (mm) and percentage of long-term mean (colour key).
page
Table 1: Rainfall June and