the South Taranaki District Council for their receipt and
information.
Cloke/Jamieson
Confirmation of Minutes State Highway 3 Working Group – 3 October 2023
Resolved
That the Taranaki Regional Transport Committee:
a. received the unconfirmed minutes of the State Highway 3 Working Group meeting held at the St
Johns Rooms, 41 North Street (SH3) Mōkau, on 3 October 2023 at 10.30am.
Duynhoven/Nixon
RTC 2024 Meetings Planner
Ms L Hawkins, Policy Manager to
Recommendations from the 2022/23 Annual Report 50
Alterations to monitoring programmes for 2024/25 51
Exercise of optional review of consent 51
Recommendations 52
Glossary of common terms and abbreviations 53
Bibliography and references 55
Appendix I Resource consents held by South Taranaki District Council
Appendix II Categories used to evaluate environmental and administrative performance
List of tables
Table 1 South Taranaki District Council water supplies resource
next season.
Waitara to Bell Block
• It was noted that future reports will include updates on the major Waitara to Bell
Block project.
• The contract to construct the Princess Street roundabout has now been awarded.
• Storm water mains have been installed with the roundabout and underpass
construction as the next step.
• It was noted that there was a ministerial event two weeks ago to commence the
project.
• Motorists will face interruptions with detours being put in
Inspections 47
10.2.2 Results of discharge monitoring 48
Incidents, investigations, and interventions 48
Evaluation of performance 49
Taranaki Sawmills Ltd 50
Site description 50
Results 51
11.2.1 Inspections 51
11.2.2 Results of discharge monitoring 51
11.2.3 Results of surface water monitoring 52
Incidents, investigations, and interventions 53
Evaluation of performance 54
Technix Group Ltd 55
Site description 55
Results 56
12.2.1 Inspections 56
switchboard (incl Tūpare, Pukeiti & Hollard Gardens): 0800 736 222 or 06 765 7127 Environmental hotline (to report pollution): 0800 736 222 Taranaki Civil Defence: 0800 900 049 Taranaki Total Mobility: 0800 868 662 Street address Taranaki Regional Council, 47 Cloten Road, Stratford. Postal address Taranaki Regional Council, Private Bag 713, Stratford 4352, New Zealand. Bus services New Plymouth Citylink bus information: 0800 87 22 87 Hawera-New Plymouth Connector bus information: 0800 22 11 20 For the
potential in the event of the dam breaking. How many people are at risk? An assessment done by Tonkin and Taylor assesses that between 11 and 100 people would be at risk in the event the dam failed, depending on the day and time. Dam failure would put 139 properties downstream of the dam in danger of being flooded to some degree, 53 of them with buildings that would likely be affected. The degree of this risk varies significantly from property to property, this detail is shown in the map. What can the
Taranaki Regional Council meeting agenda May 2020
page
HIGHLANDS
NPBHS
OMATA RD
ARIKI ST
95
3.30PM
3.15PM
3.20PM
RO
G
AN S
T
FILLIS ST
SCHOOL SERVICE* ROUTE 95 Highlands Intermediate to Ariki Street
AFTERNOON ONLY
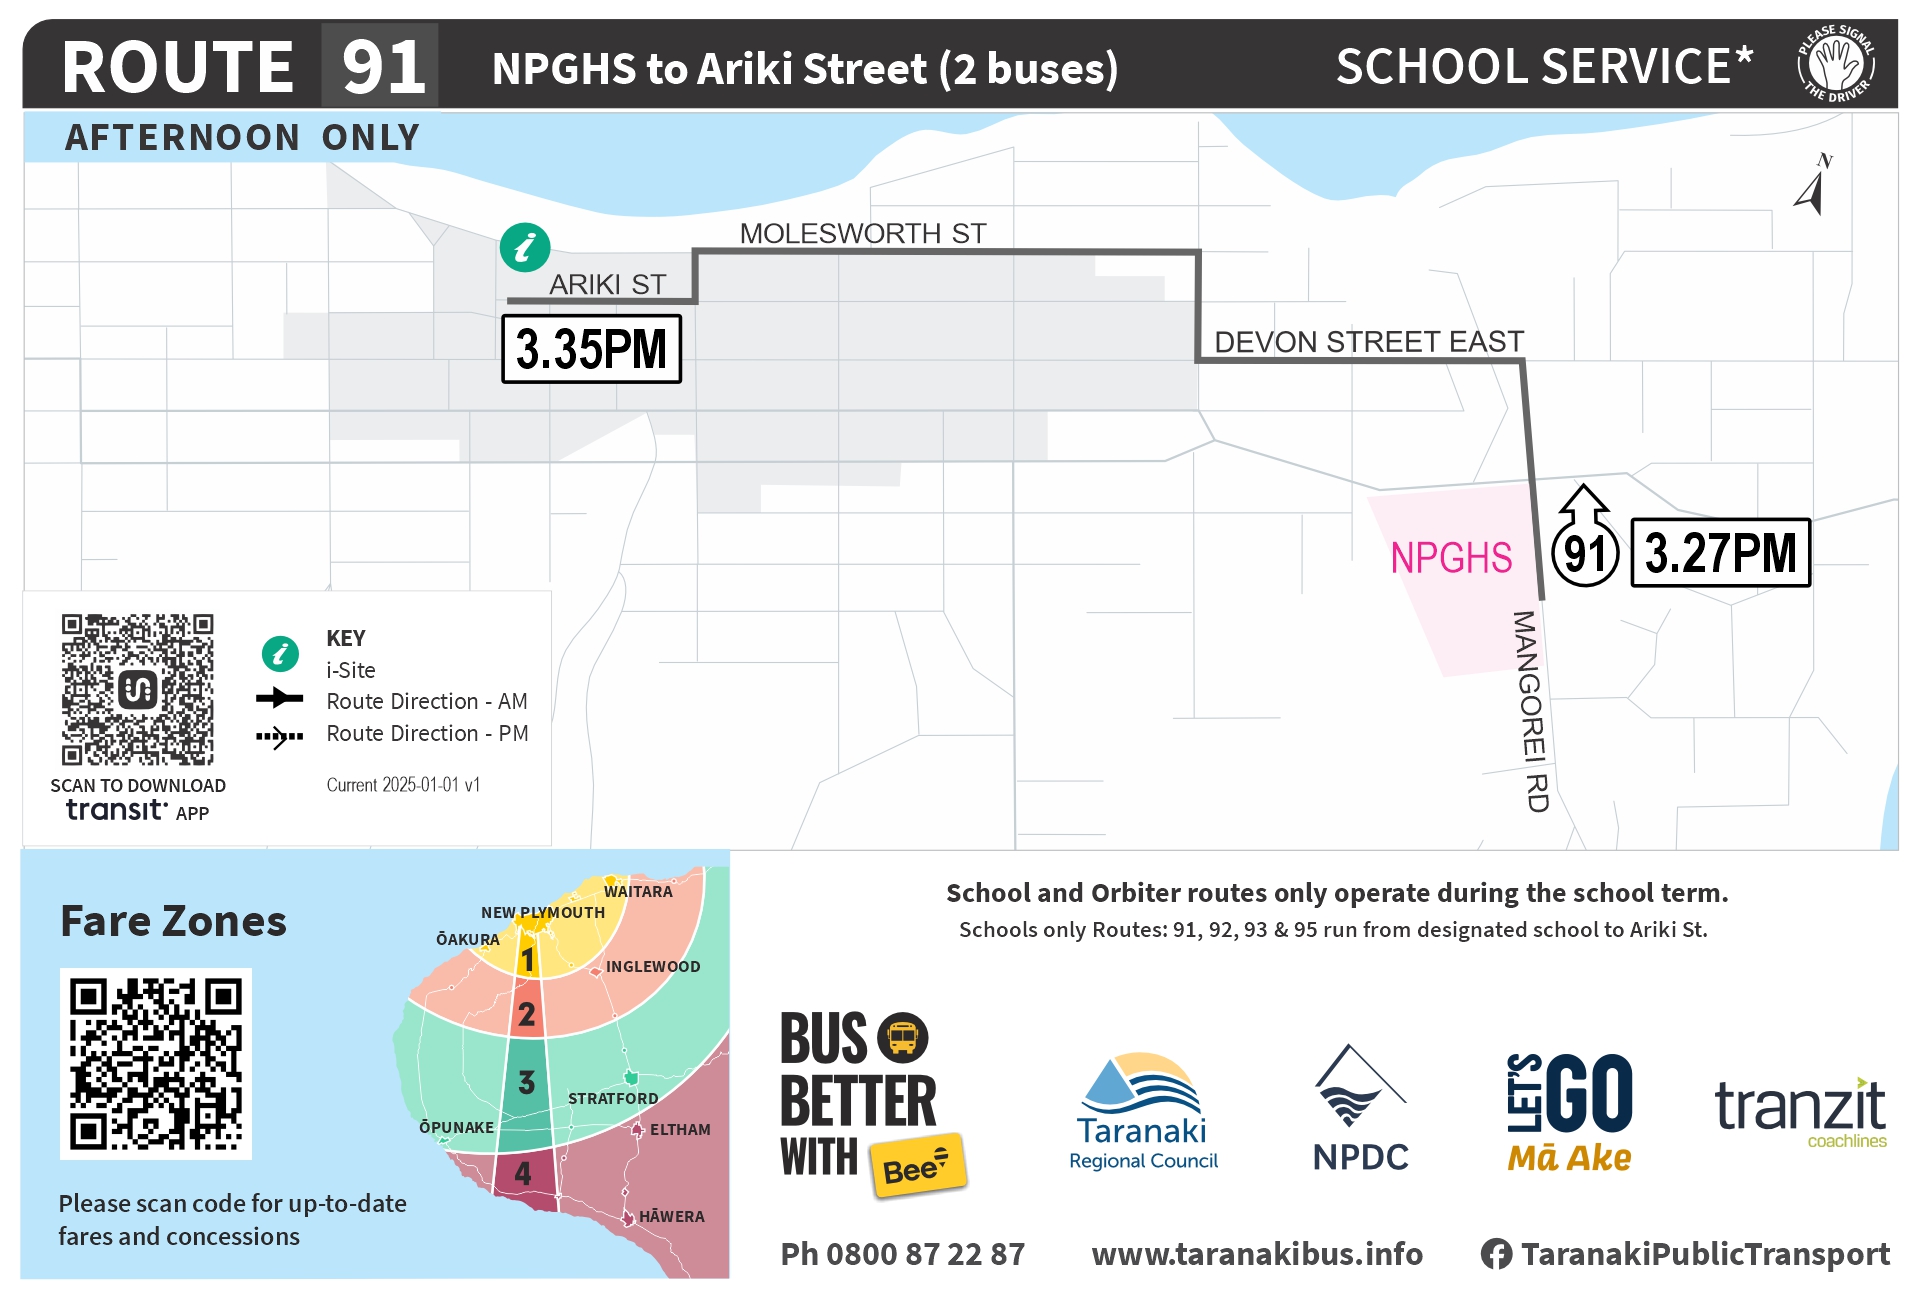
Schools only Routes: 91, 92, 93 & 95 run from designated school to Ariki St.
School and Orbiter routes only operate during the school term.
Ph 0800 87 22 87 www.taranakibus.info TaranakiPublicTransport
INGLEWOOD
ELTHAM
STRATFORD
ŌPUNAKE
HĀWERA
NEW PLYMOUTH
WAITARA