Tēnā koutou. This year’s annual waterways report card is more timely and important than ever.
Amid the national conversation on the Government’s new proposals seeking to improve rivers and streams, this report offers a chance to assess regional progress so far, reflect on the lessons learned, and think about the best way forward.
We all want our waterways to be healthy. And the Taranaki community has not been standing idly by waiting for the right regulations. Download this report as a PDF and you'll also see a brief outline of the enormous voluntary effort by landowners to fence and plant thousands of kilometres of ringplain and coastal rivers and streams. The finish line is in sight. And as the results summarised here show, the effort is getting good results. That’s been confirmed in an independent NIWA report.
Industries and communities have also had a role in the freshwater gains we’re seeing, investing millions of dollars to eliminate or heavily curtail the environmental impacts of wastewater discharges.
A report by Business and Economic Research Ltd found that region-wide, the Taranaki community invested $117 million in environmental improvements in the six years to 2014. A large portion of this was devoted to waterways, with $279.7 million being spent on capital and annual operating costs in the same period.
And the quest for improvements continues. The Council is requiring dairy farmers to switch to land-based effluent disposal as current consents expire. We’re still working with the community to formulate other measures.
In summary, the region is making major efforts and spending big money to improve rivers and streams. The actions it’s taking are the result of careful consideration. They’re happening at a measured pace. And clearly, they’re getting good results.
That’s a useful template for assessing and evaluating the Government’s latest proposals: Will they get good results? Is the science sound? Are they practical, efficient and reasonable? And most importantly, what impacts will they have on families and communities?
The information supplied so far by the Government and its advisers would appear to fall short of adequately answering these questions. We hope that Wellington will give the Taranaki experience the careful consideration we believe it deserves.
A major concern is that as they stand, the Government’s proposals would frustrate and set back the good work happening here. The last thing New Zealand needs is productive regions like Taranaki being hit with blunt, one-size-fits-all regulations that cause massive upheaval but achieve little or no improvement in the health of our rivers and streams

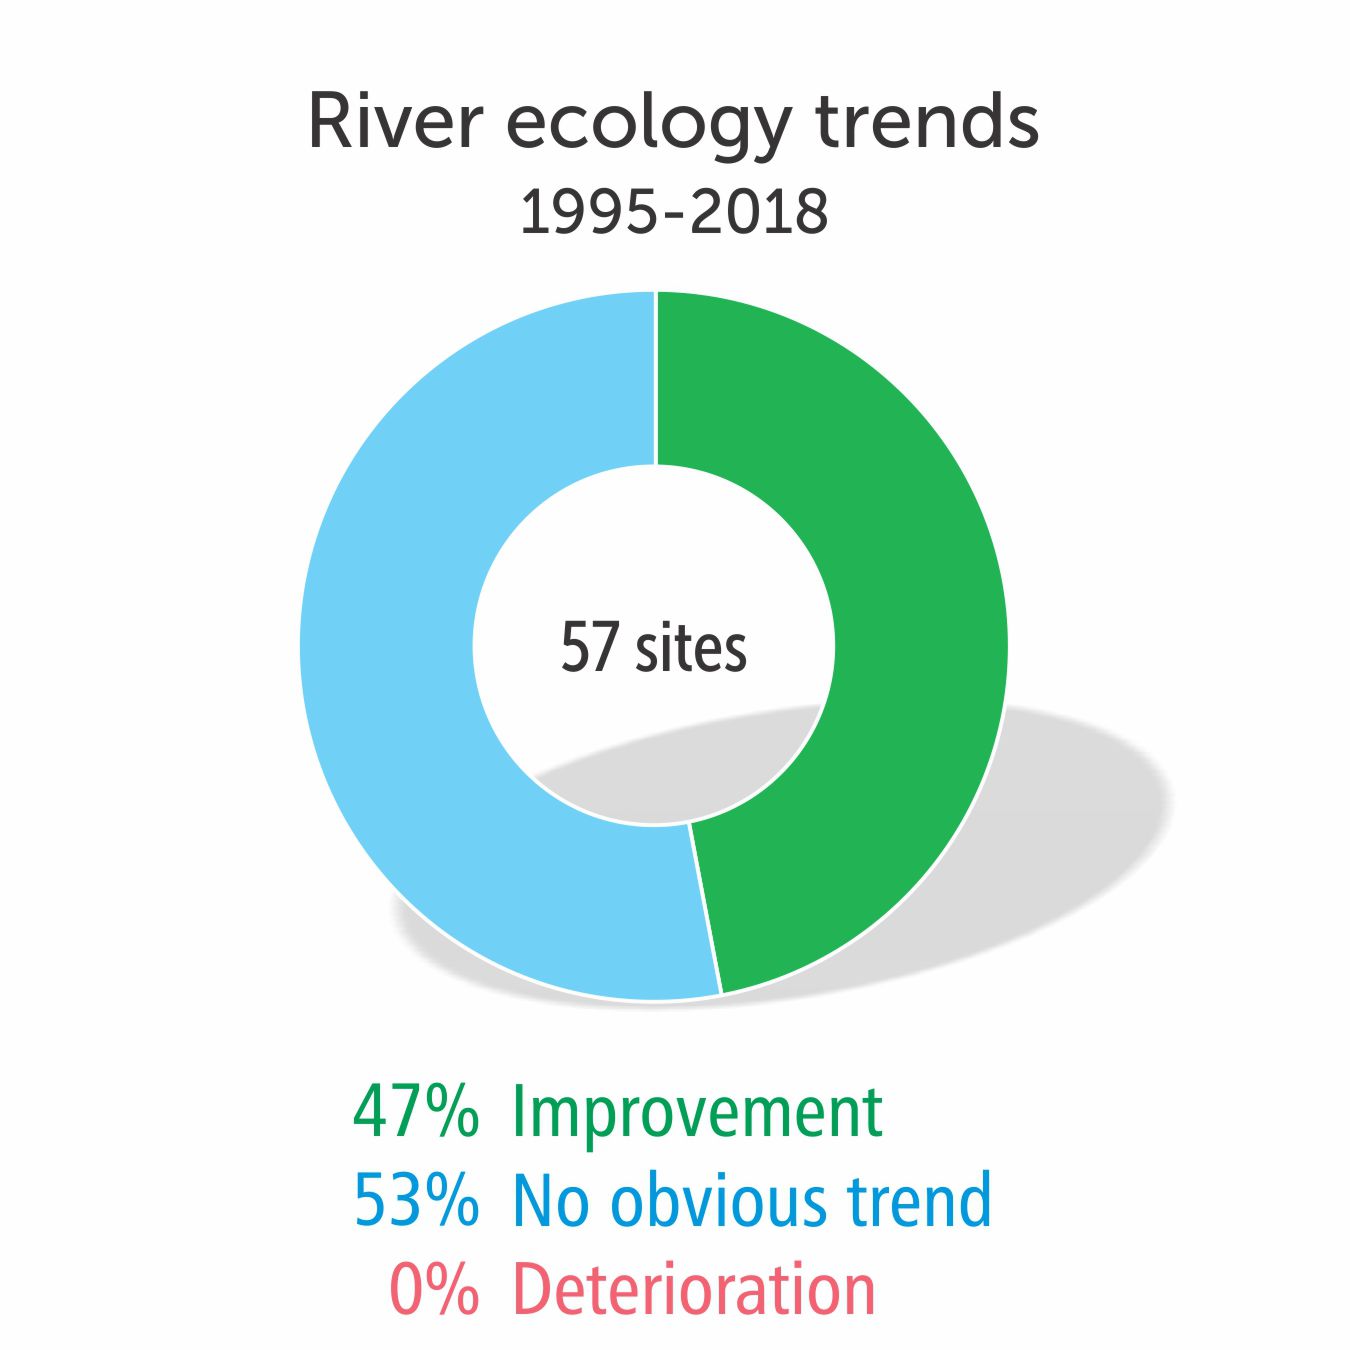
The ecological health of waterways is assessed by studying the small critters and organisms in streams and rivers, and is the primary measure of freshwater quality. Across the region, our rivers and streams are improving or not showing any significant changes. At more and more sites, we’re seeing the best results since monitoring began in 1995.

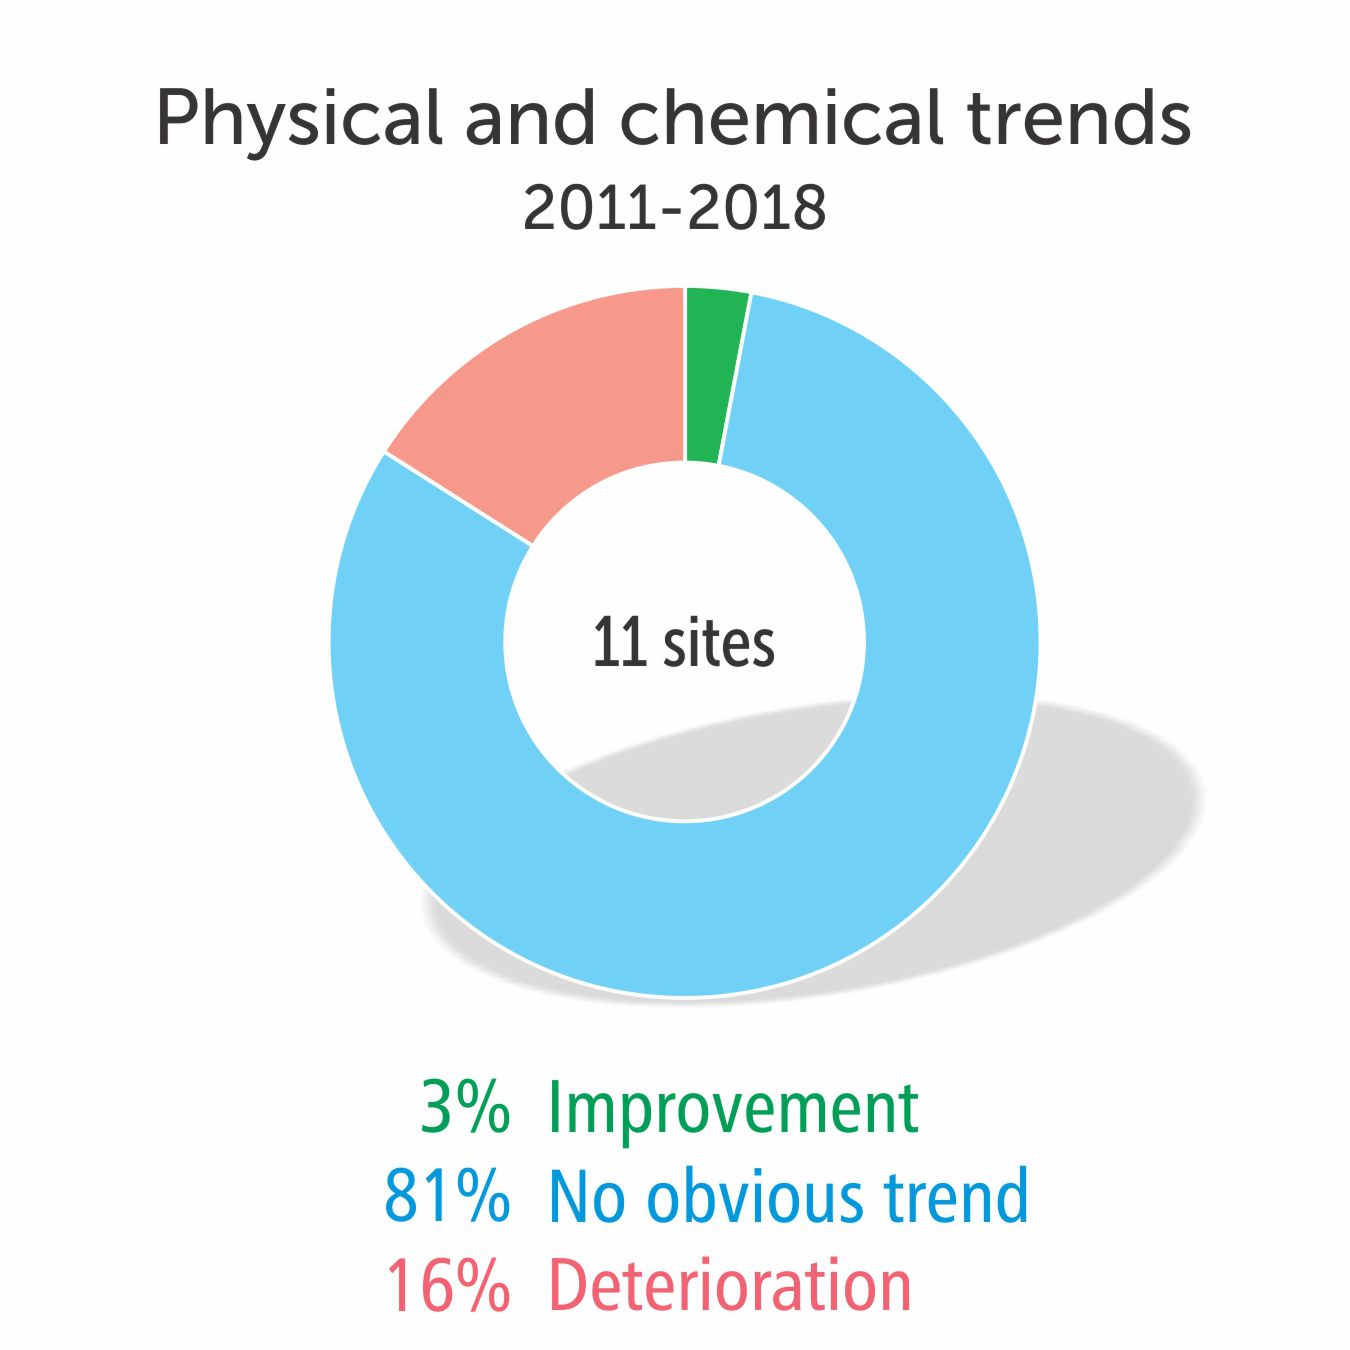
Measuring organic contamination, nutrient concentrations and aesthetic quality can flag pressures on waterways and indicate where to best focus our attention. The picture in Taranaki is largely stable but our aim is to achieve more improvements and fewer declines. Fewer sites are showing deterioration, particularly in nutrient concentrations.
Freshwater physicochemical monitoring 2017-2018 [PDF, 2.8 MB]

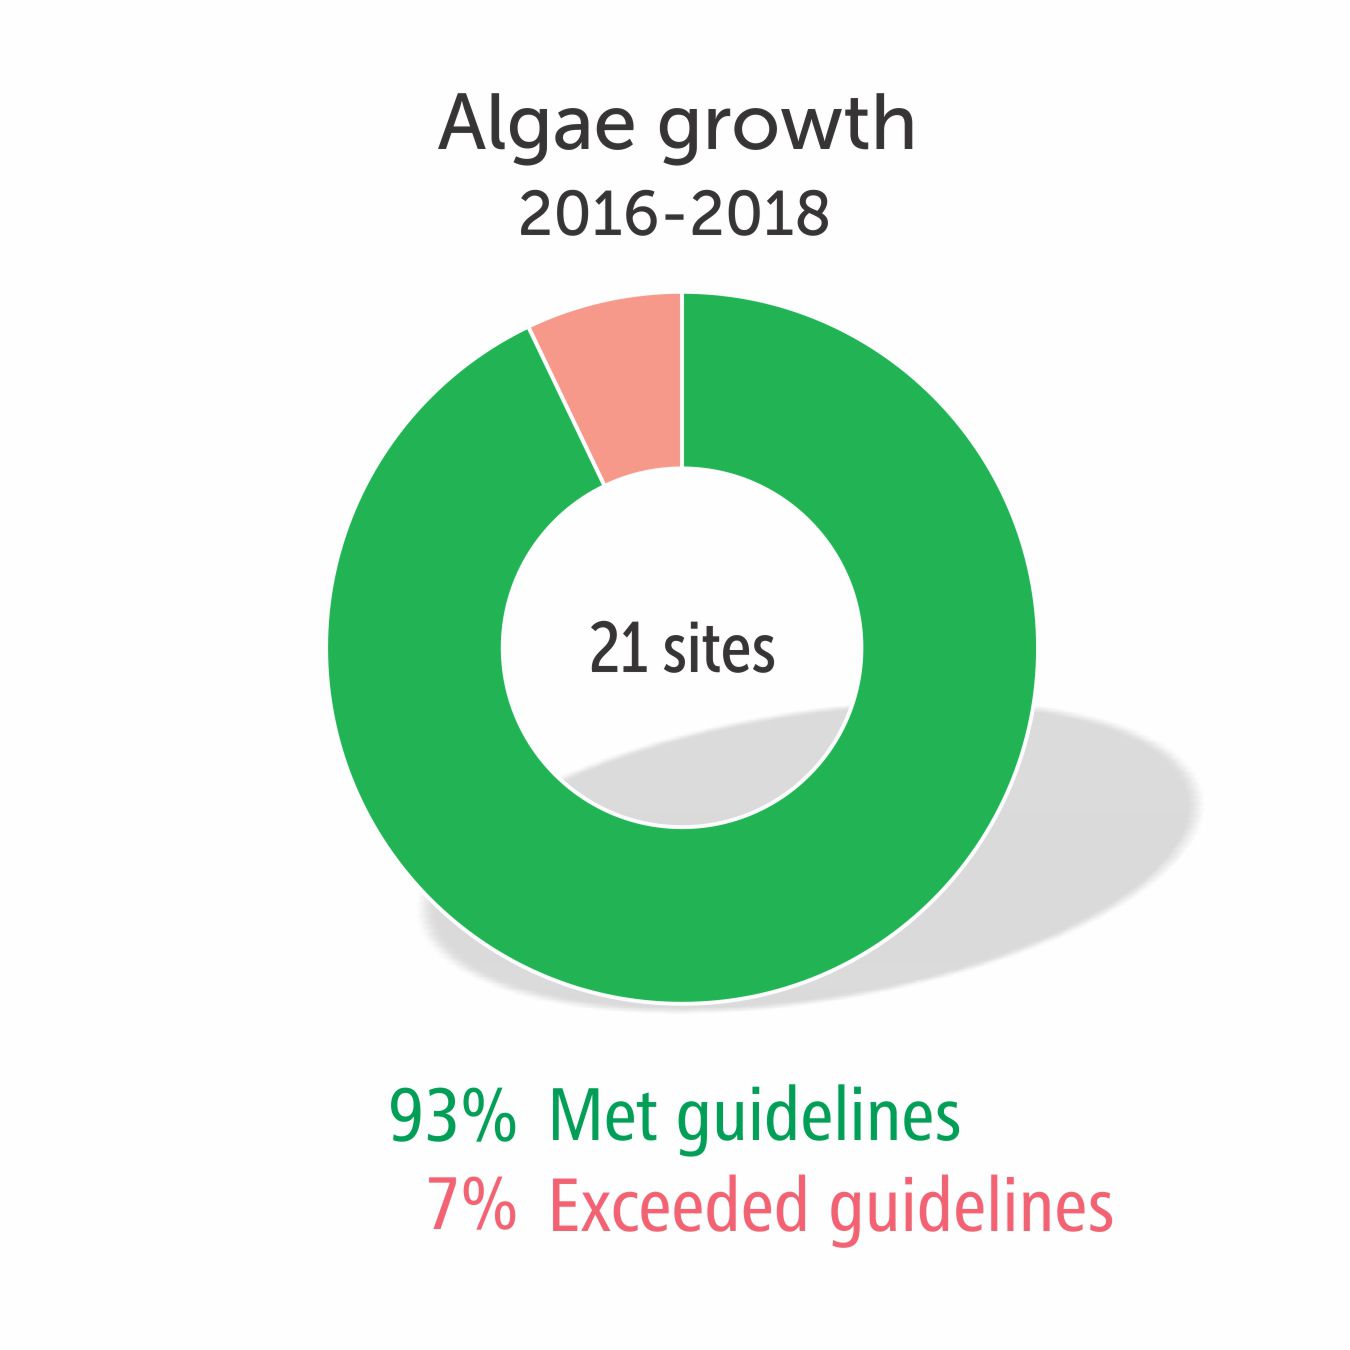
Algae, or periphyton, is essential for aquatic ecosystems but excessive levels can cause environmental and/or health problems. Just about all of Taranaki’s monitored sites meet national guidelines all the time.
The Government has set compulsory standards for a number of water-quality measures year round. All the toxicant measurements at the Council's monitoring sites meet the standards, with more than two-thirds achieving the best score.


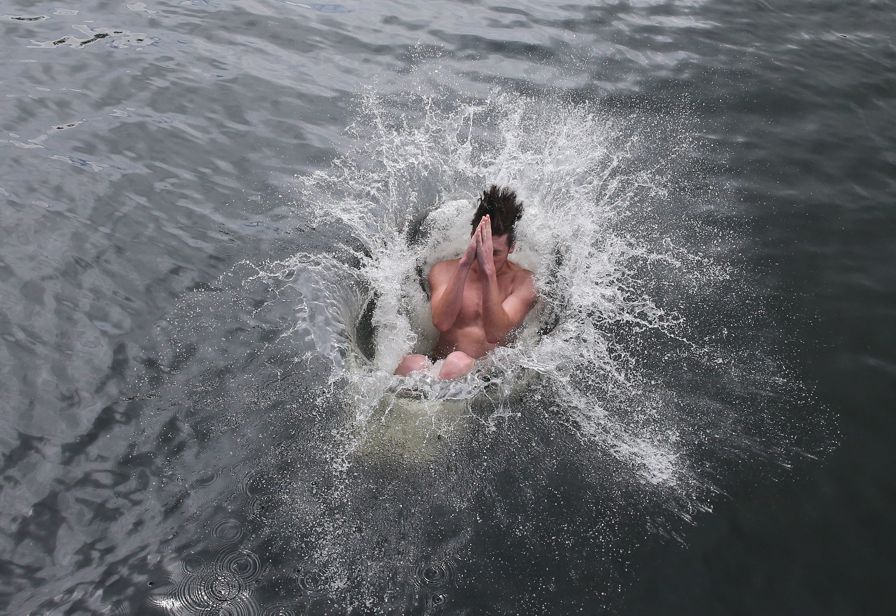
Over summer, the Council monitors popular swimming spots on the coast (where most people swim) and at our rivers and streams. Freshwater sites are mostly good, with contamination by wildfowl and gulls the main problem at two urban sites. Coastal sites are consistently good with all sites meeting the swimming guidelines apart from one sample at one site.
Coastal water quality monitoring summer 2018-2019 [PDF, 6.2 MB]
Freshwater recreational bathing monitoring summer 2018-2019 [PDF, 5.3 MB]

