Your search for 'rainfall' returned 1425 results.
TRC Bulletin - 21 November 2017
Taranaki’s temperature trends. Sunshine hours and wind speeds in North Taranaki have increased, while winter rainfall has decreased and severe weather events have become fewer and less intense. South Taranaki has seen an increase in spring rainfall. The Committee was told that the Resource Management Act explicitly excludes the Council from climate change regulation, but future likely consequences, particularly for rainfall, are being factored into plans and projects, most notably the recent upgrades to
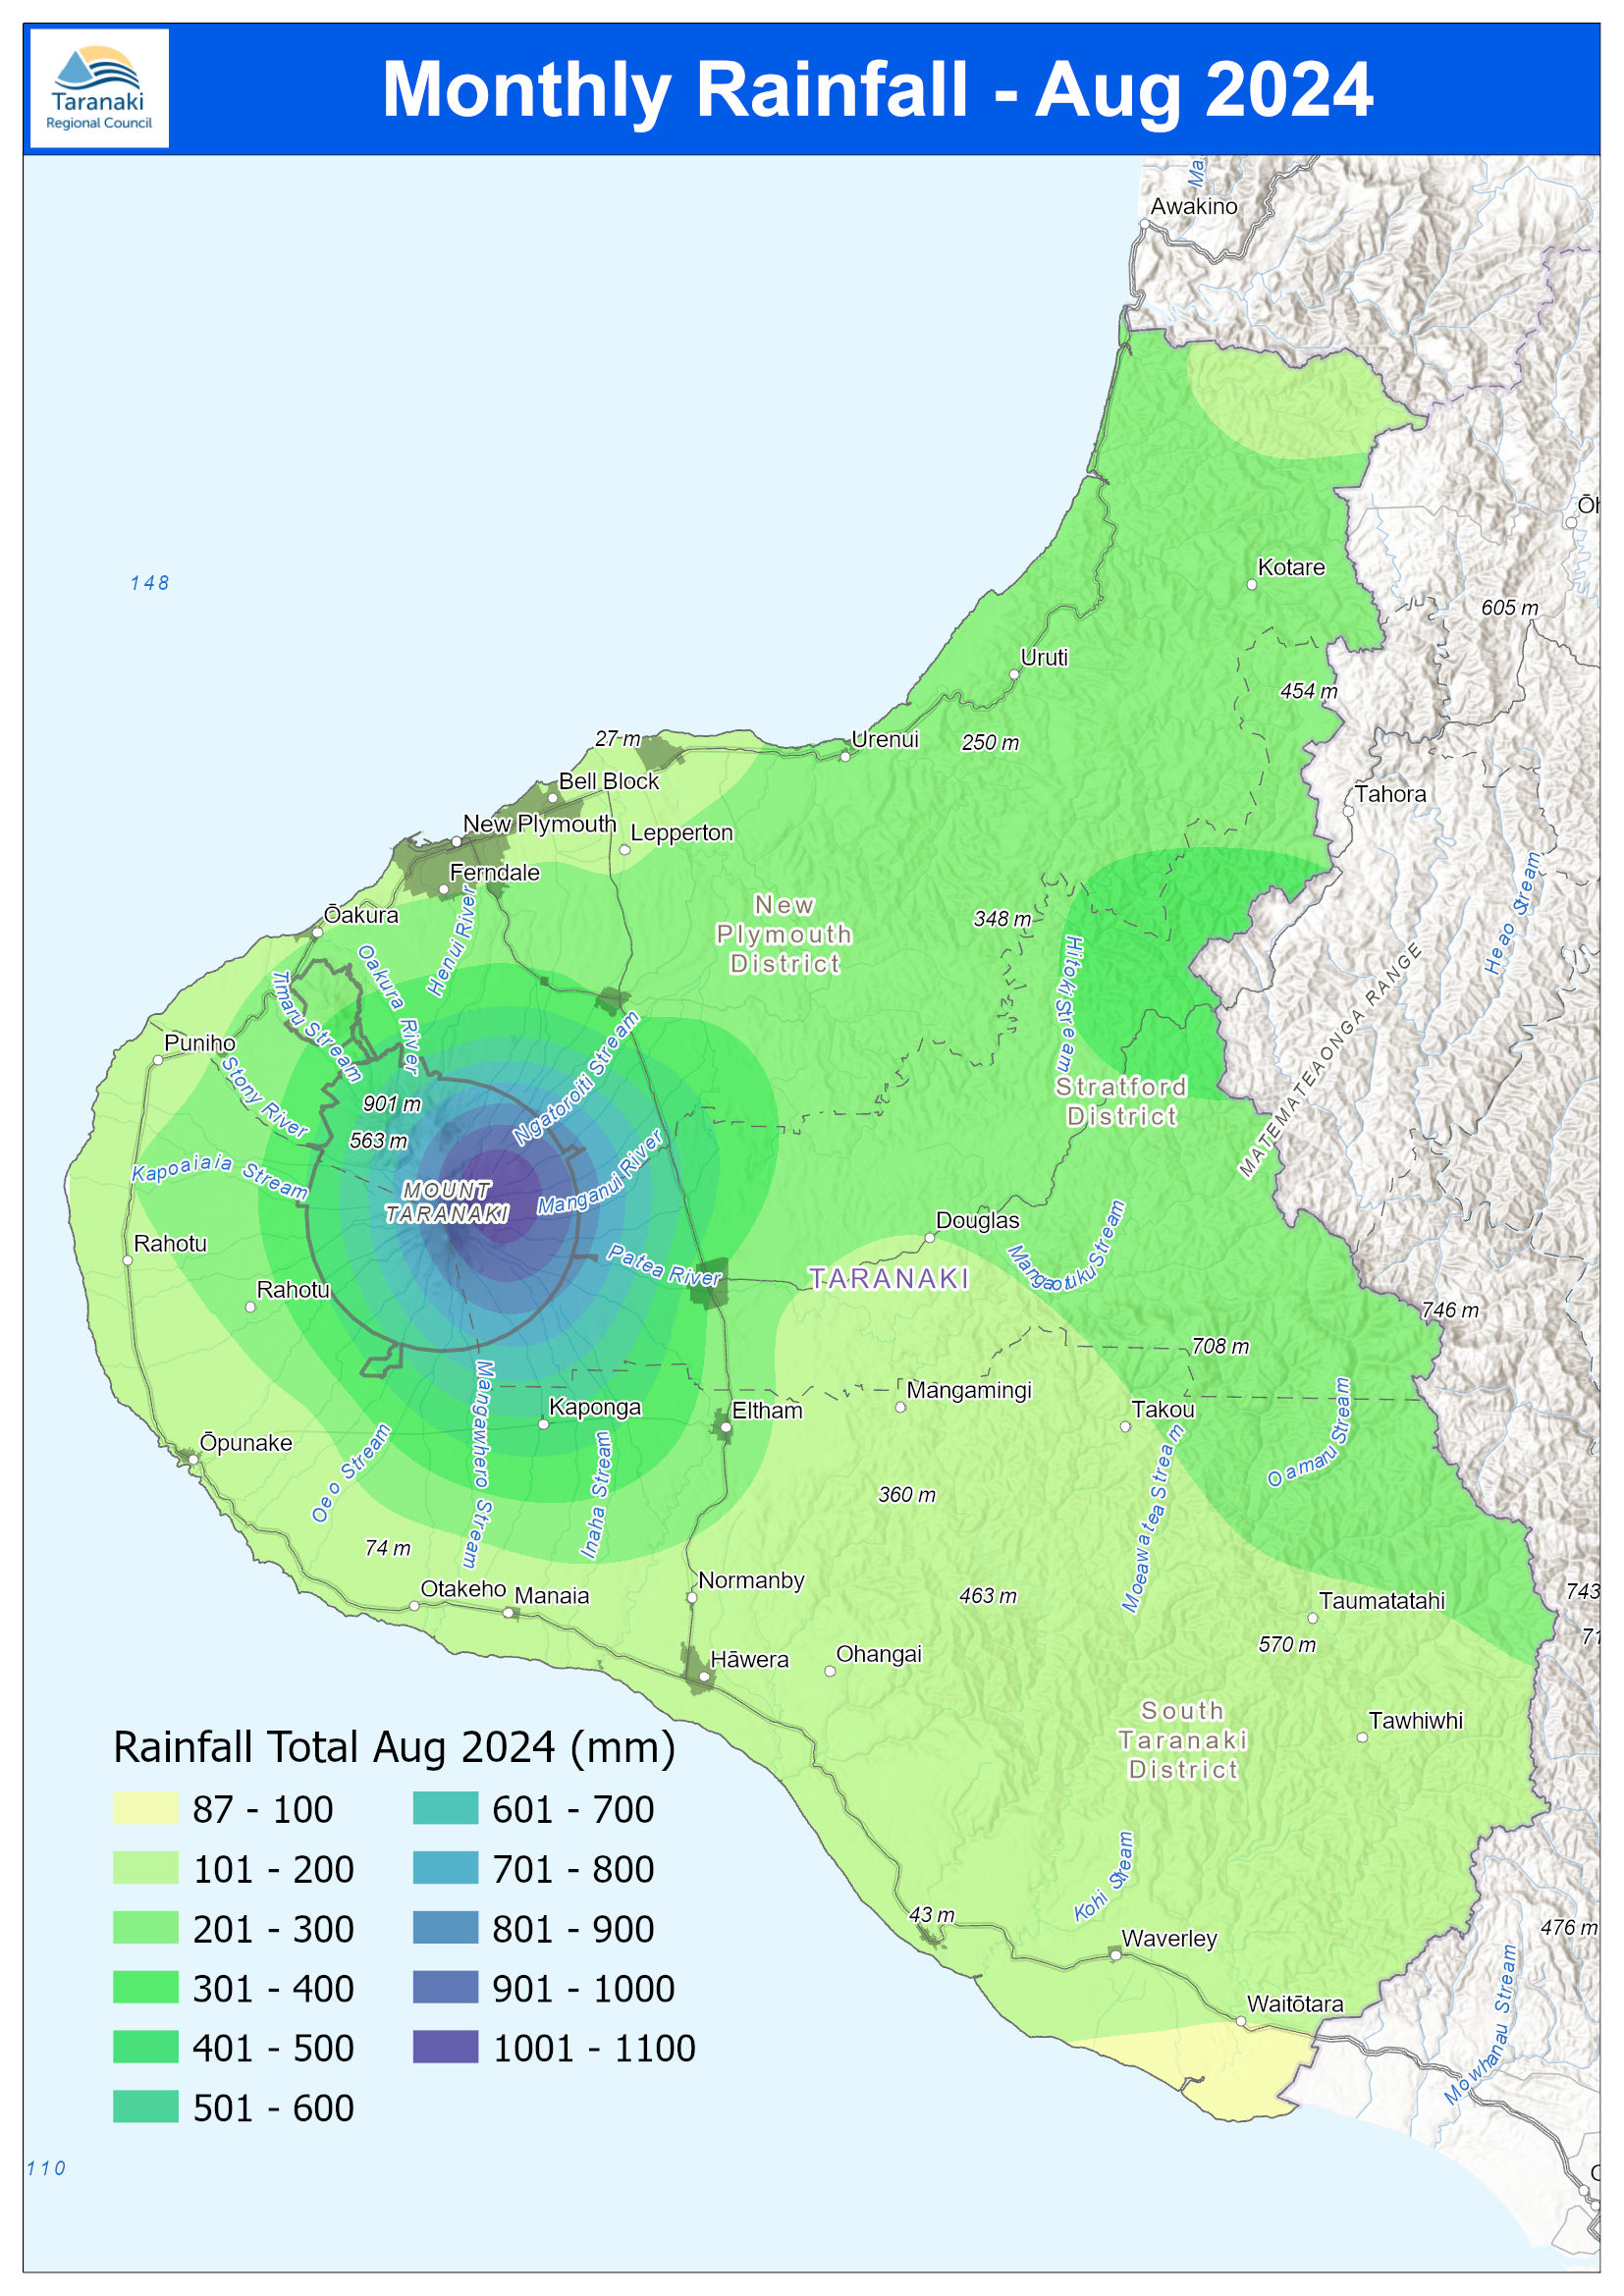
August 2024 Rainfall Adobe 896x616
August 2024 Rainfall monthly total
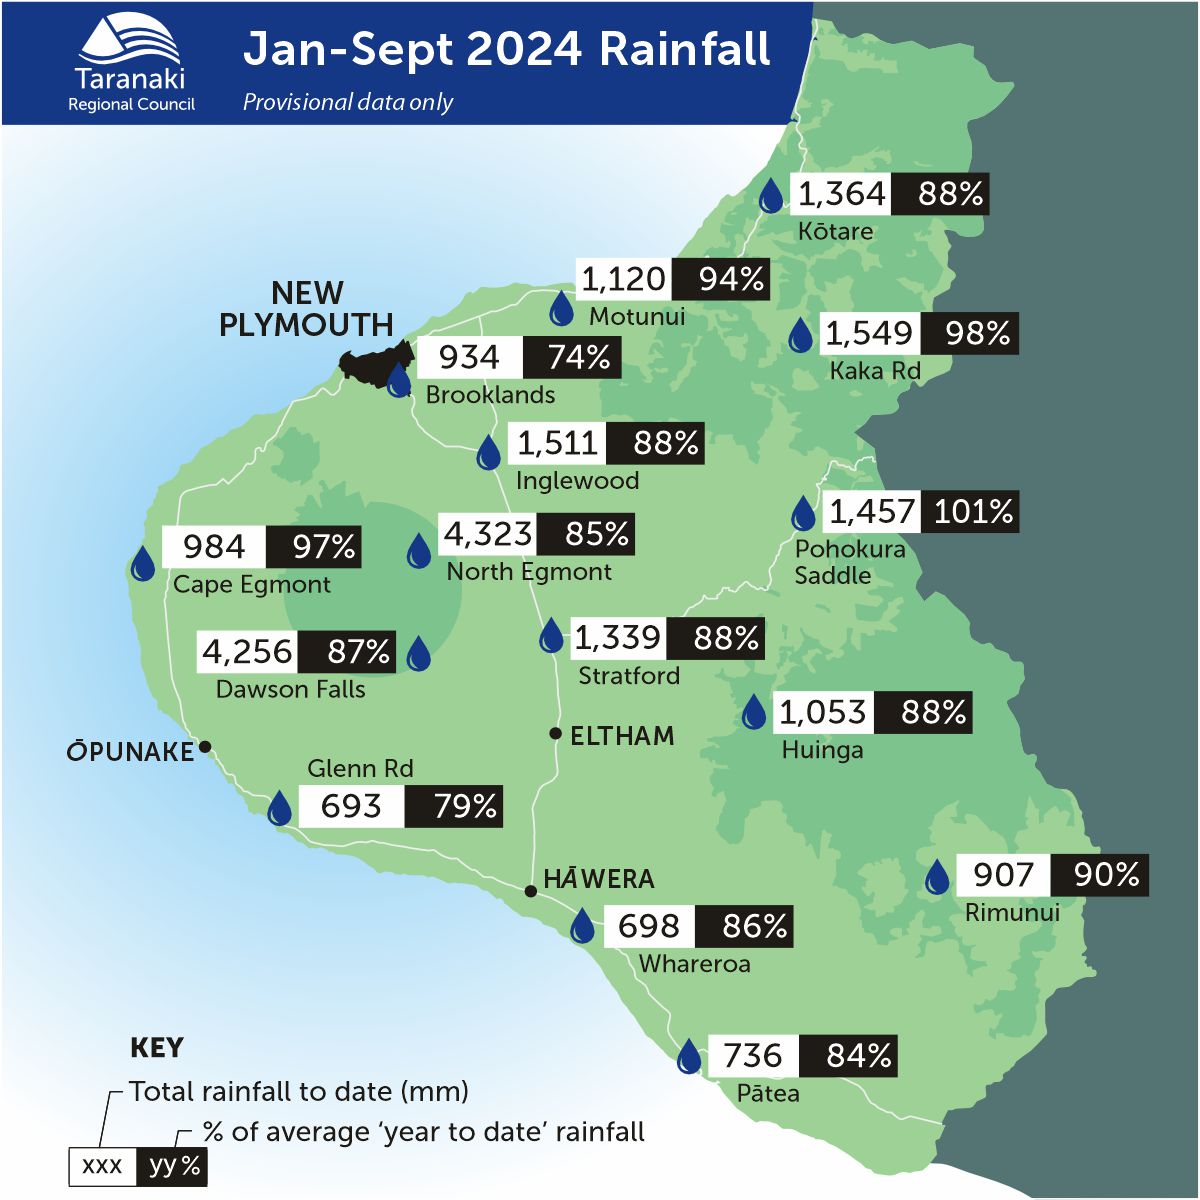
January to August 2024 Rainfall
TRC Climate Summary Report April 2025
page Taranaki Regional Council Monthly Rainfall and Environmental Data Report for April 2025 Note: The data presented here are provisional data only and may change as a result of quality control at a later date. 1. Rainfall Map 1: April total rainfall (mm) and percentage of long-term mean (colour key). page Map 1a. Total rainfall 1 January to end April (mm) and percentage of long-term mean (colour key). page Table 1: Rainfall April
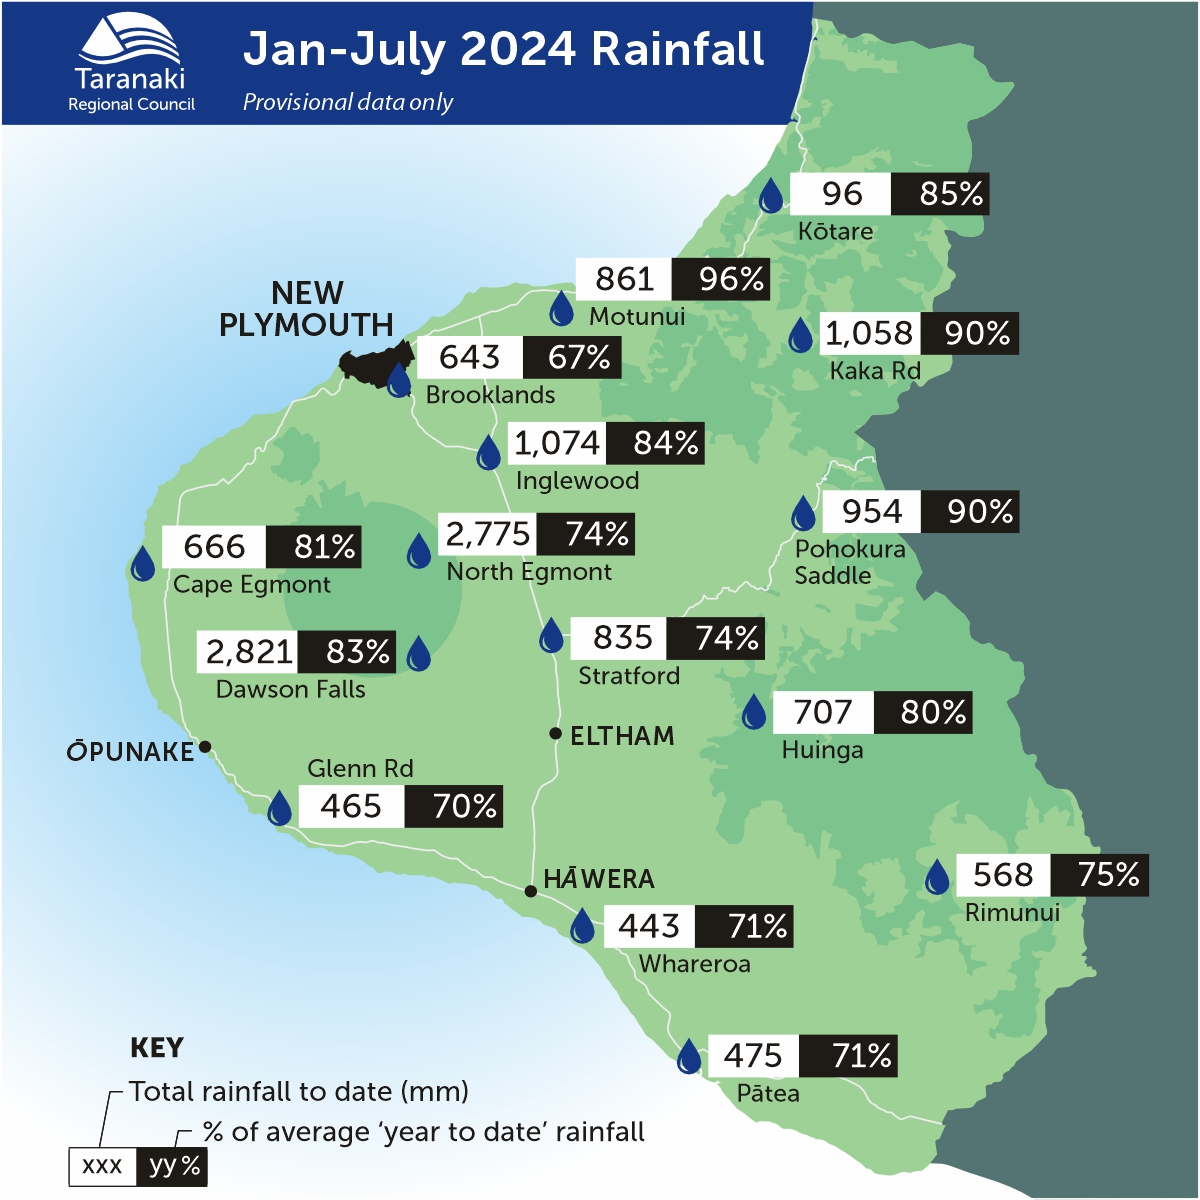
January to July 2024 Rainfall
Land & agriculture
management of oil and gas operations in Taranaki (1.1 MB pdf) Managing diffuse-source discharges to land and water in Taranaki (1.3 MB pdf) Future directions for management of gravel extraction in Taranaki rivers and streams (311 KB pdf) June 2015 flood event Heavy rainfall on 19 and 20 June 2015 resulted in severe but localised flooding and landslips in the lower and mid reaches of the Whenuakura and Waitotara catchments, throughout the Patea catchment, in the hillcountry between Toko and Whangamomonoa,
2020 rainfall maps
… page page December 2020 Year to Date Rainfall millimetres 0-500 501-1000 1001-1500 1501-2000 2001-2500 2501-3000 3001-3500 3501-4000 4001-4500 4501-5000 5001-5500 5501-6000 6001-6500 2020 rainfall (January-December) - monitored sites 2020 rainfall (January-December) distribution