Tēnā koutou. This year more than ever, it’s fitting to take stock of Taranaki’s progress in improving the health of our rivers and streams, and discuss where we need to go from here.
As a region and as a nation, we’re at a turning point in the way we manage our precious freshwater resource. We’re embarking on a new journey and everyone should be on board.
But first, how have we been doing so far? As in recent years, our monitoring results are encouraging. This is particularly the case for the overall ecological health of our rivers and streams, and for summer swimmability at popular recreational sites inland (fresh water) as well as on the coast (marine). Our rivers and streams also stack up pretty well against existing national standards.
It’s worth pointing out again that our progress is not just a matter of good luck. It’s the result of investment and hard work – by farmers, fencing and planting their streambanks, and by industry and communities eliminating waste discharges to waterways, or significantly reducing their impact. We’re talking about millions of dollars and thousands of hours of work. And in the case of farmers, it’s been voluntary.
But there’s more work ahead of us. The Government is taking a fresh approach to freshwater management, and new requirements have started to emerge. Those of you involved in activities that may affect rivers and streams should already be aware that new regulations probably require your urgent attention. The Council is working directly with consent holders and sector groups to ensure efficient and effective compliance.
On a broader horizon, regional councils are now also required to ‘consider and recognise’ Te Mana o te Wai in freshwater management, and to identify and reflect tangata whenua values and interests in the management of freshwater and in decision-making around freshwater planning.
This gives fresh impetus to ongoing Iwi-Council discussions in Taranaki to find a meaningful and workable framework for iwi participation in freshwater management. The path ahead is both exciting and challenging. We’ll see changes in decision-making processes and the development of extra monitoring methods based on mātauranga Māori. Other possibilities will become apparent as discussions continue.
We cannot and should not opt out of this new journey. The challenge is to find the smartest and most efficient way forward. And I have every confidence that you, the resilient and resourceful people of Taranaki, can rise to the challenge.
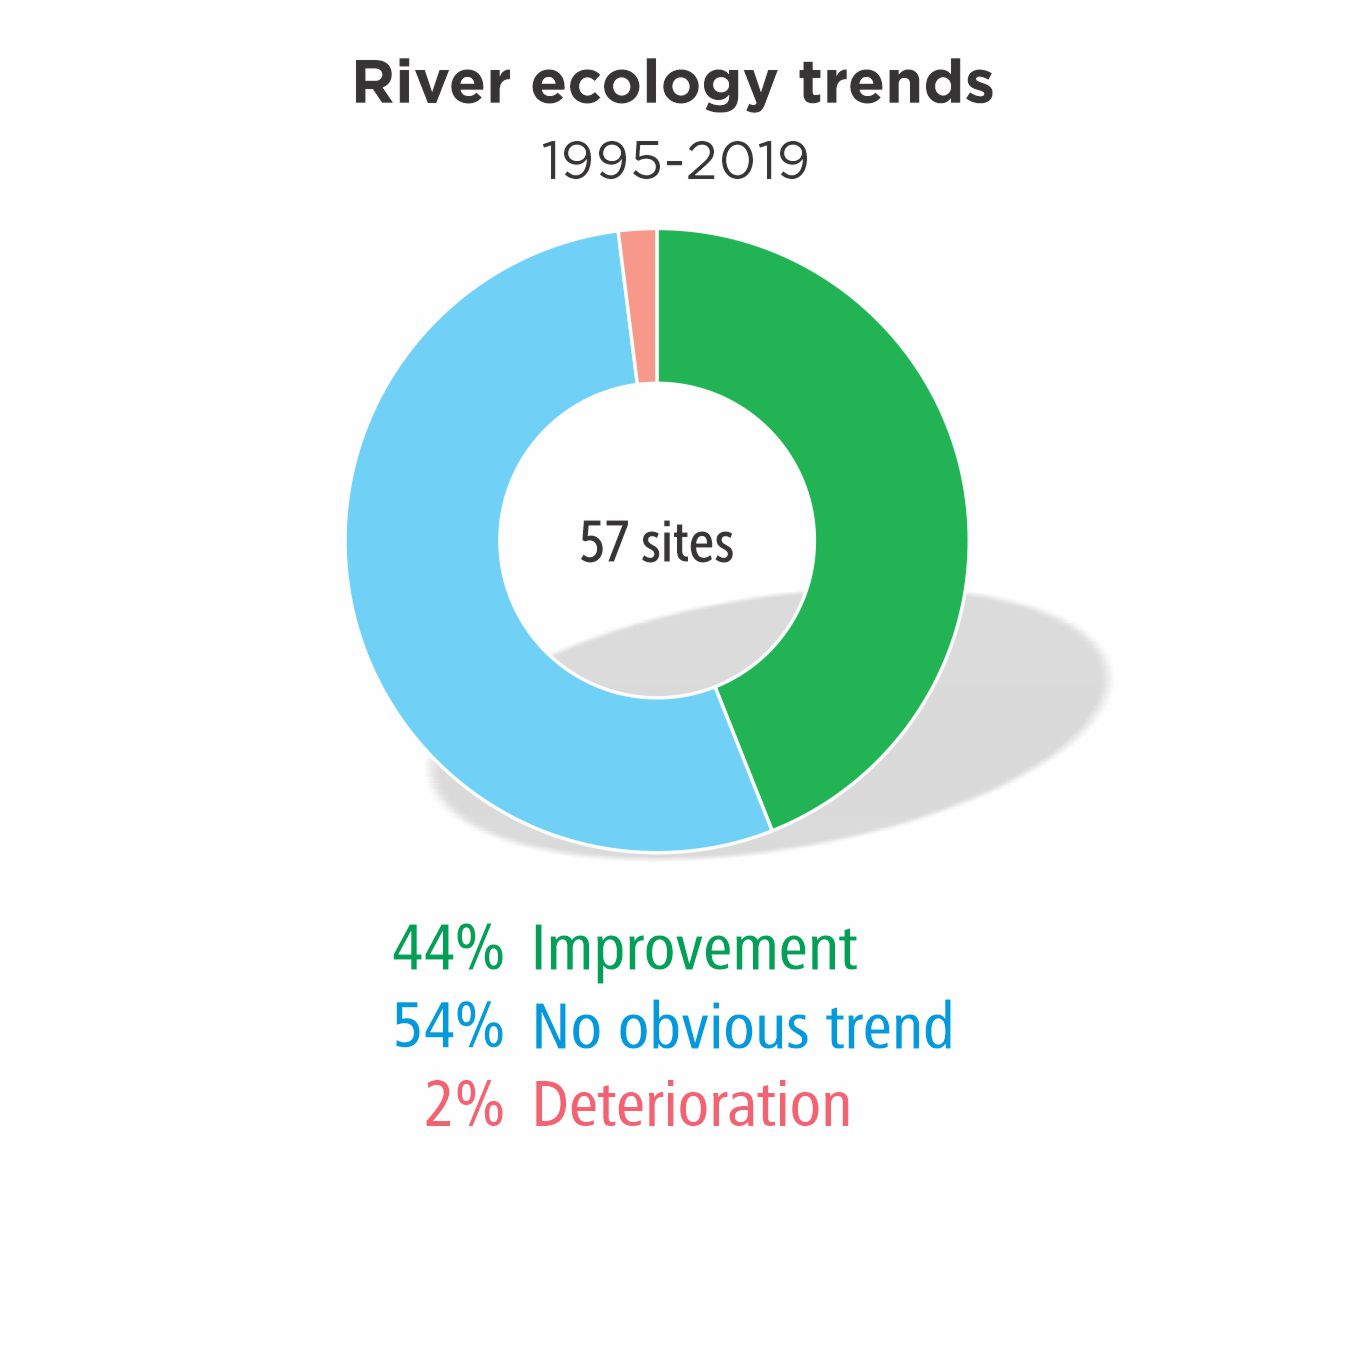
River ecology trends 1995-2019
44% Improvement | 45% No obvious trends | 2% Deterioration

The ecological health of waterways is assessed by studying the small critters and organisms in streams and rivers, and is the primary measure of freshwater quality. Across the region, almost all our rivers and streams are improving or not showing any significant changes. At many sites, we’re seeing the best results since monitoring began in 1995.
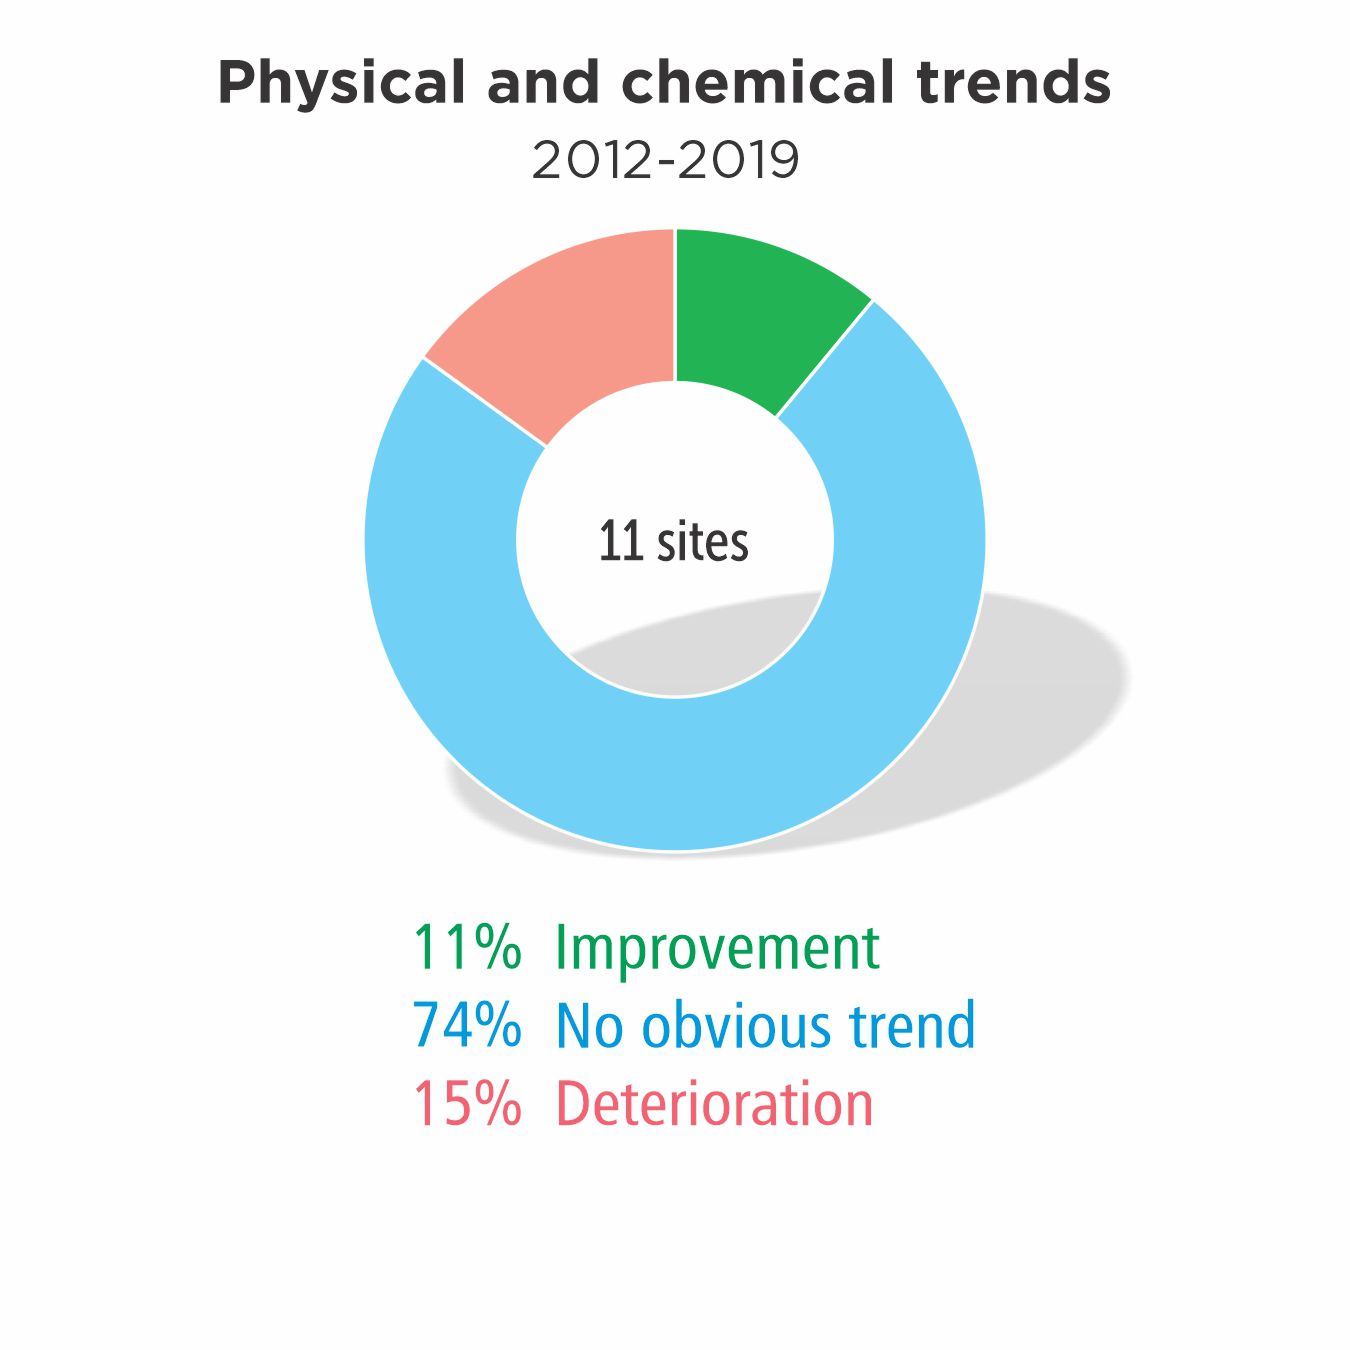
Physical & chemical trends 2012-2019
11% Improvement | 74% No obvious trends | 15% Deterioration

Measuring organic contamination, nutrient concentrations and aesthetic quality can flag pressures on waterways and indicate where to best focus our attention. The picture in Taranaki is largely stable but our aim is to achieve more improvements and fewer declines. More sites are showing improvement, particularly in nutrient concentrations.
Freshwater physicochemical monitoring 2018-2019 [PDF, 2.8 MB]
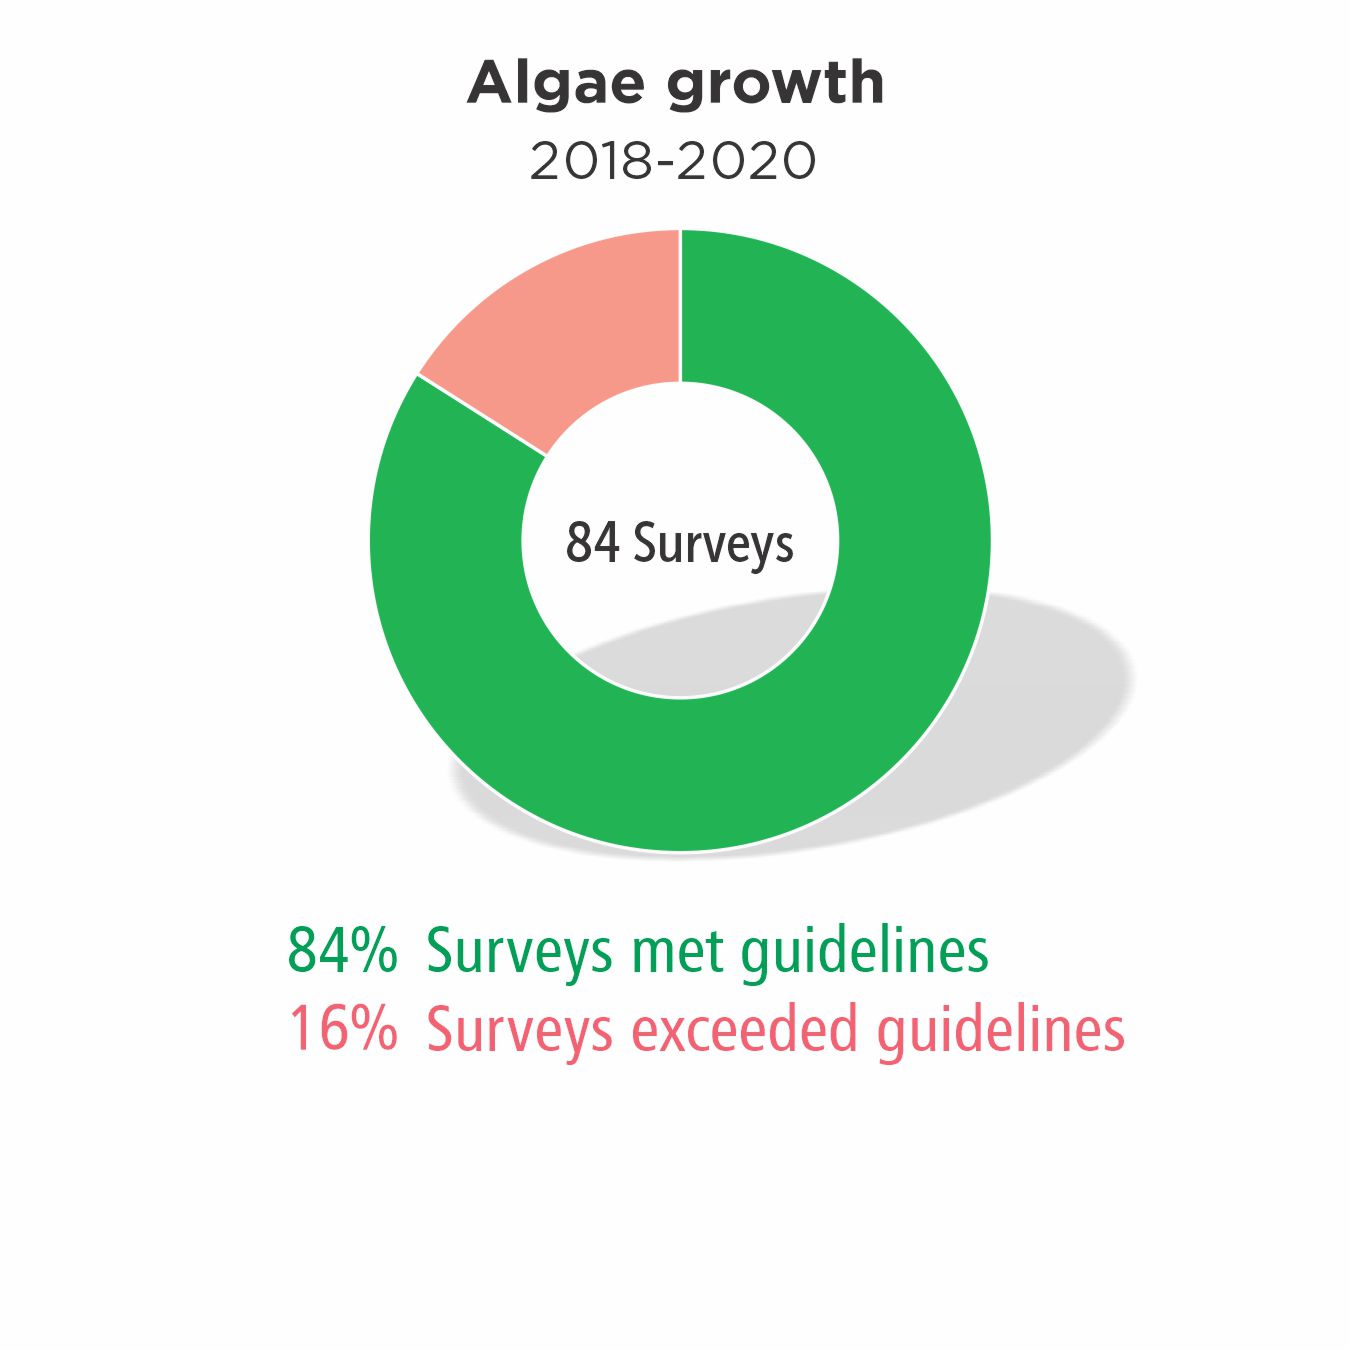
Algae growth 2018-2020
84% Surveys met guidelines | 16% Surveys exceeded guidelines

Algae, or periphyton, is essential for aquatic ecosystems but excessive levels can cause environmental and/or health problems. Just about all of Taranaki’s 21 monitored sites meet national guidelines all the time.
National standards 2016-2019
The Government has set compulsory standards for a number of water-quality measures year round. All the toxicant measurements at 15 Taranaki sites meet ecological standards, with more than two-thirds achieving the best score.
Freshwater physicochemical monitoring 2018-2019 [PDF, 2.8 MB]
Note: ecological and human health measures are based on attribute states detailed in the 2017 amendment to 2014 National Policy Statement for Freshwater Management (NPS-FM) and were current for the period of analysis. The NPS-FM has undergone further amendments as of August 2020 and some of the measures have since been modified.


Sampled all year in all flow conditions.
Many of the sites are too shallow, cold and/or small for recreational bathing activities.
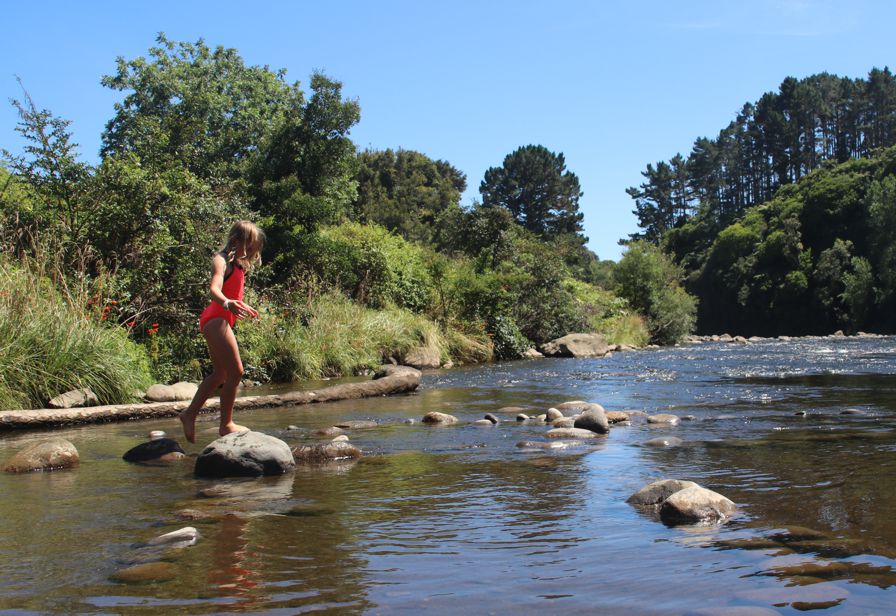
Can I swim?
Over summer, the Council monitors popular swimming spots on the coast (where most people swim) and at our rivers and streams. In general, most freshwater sites show water quality is acceptable for recreational bathing activities like swimming. The majority of unacceptable samples were detected at three sites, near the mouths of the Waiwhakaiho River, and the Te Hēnui and Waimōku streams. Contamination at these sites is most likely from wild populations of water fowl, gulls and pigeons. Coastal sites were consistently acceptable, with all sites meeting the recreational guidelines.
Note: only 11 of the planned 13 surveys were successfully completed over the 2019/2020 summer sampling period. Due to the Covid-19 pandemic and the nationwide lockdown between 25 March and 27 April 2020, the final two scheduled sampling surveys could not be carried out.

