Your search for 'rainfall' returned 1425 results.
2010 rainfall
2012 rainfall
2013 rainfall
2015 rainfall
2011 rainfall
2008 rainfall
2009 rainfall
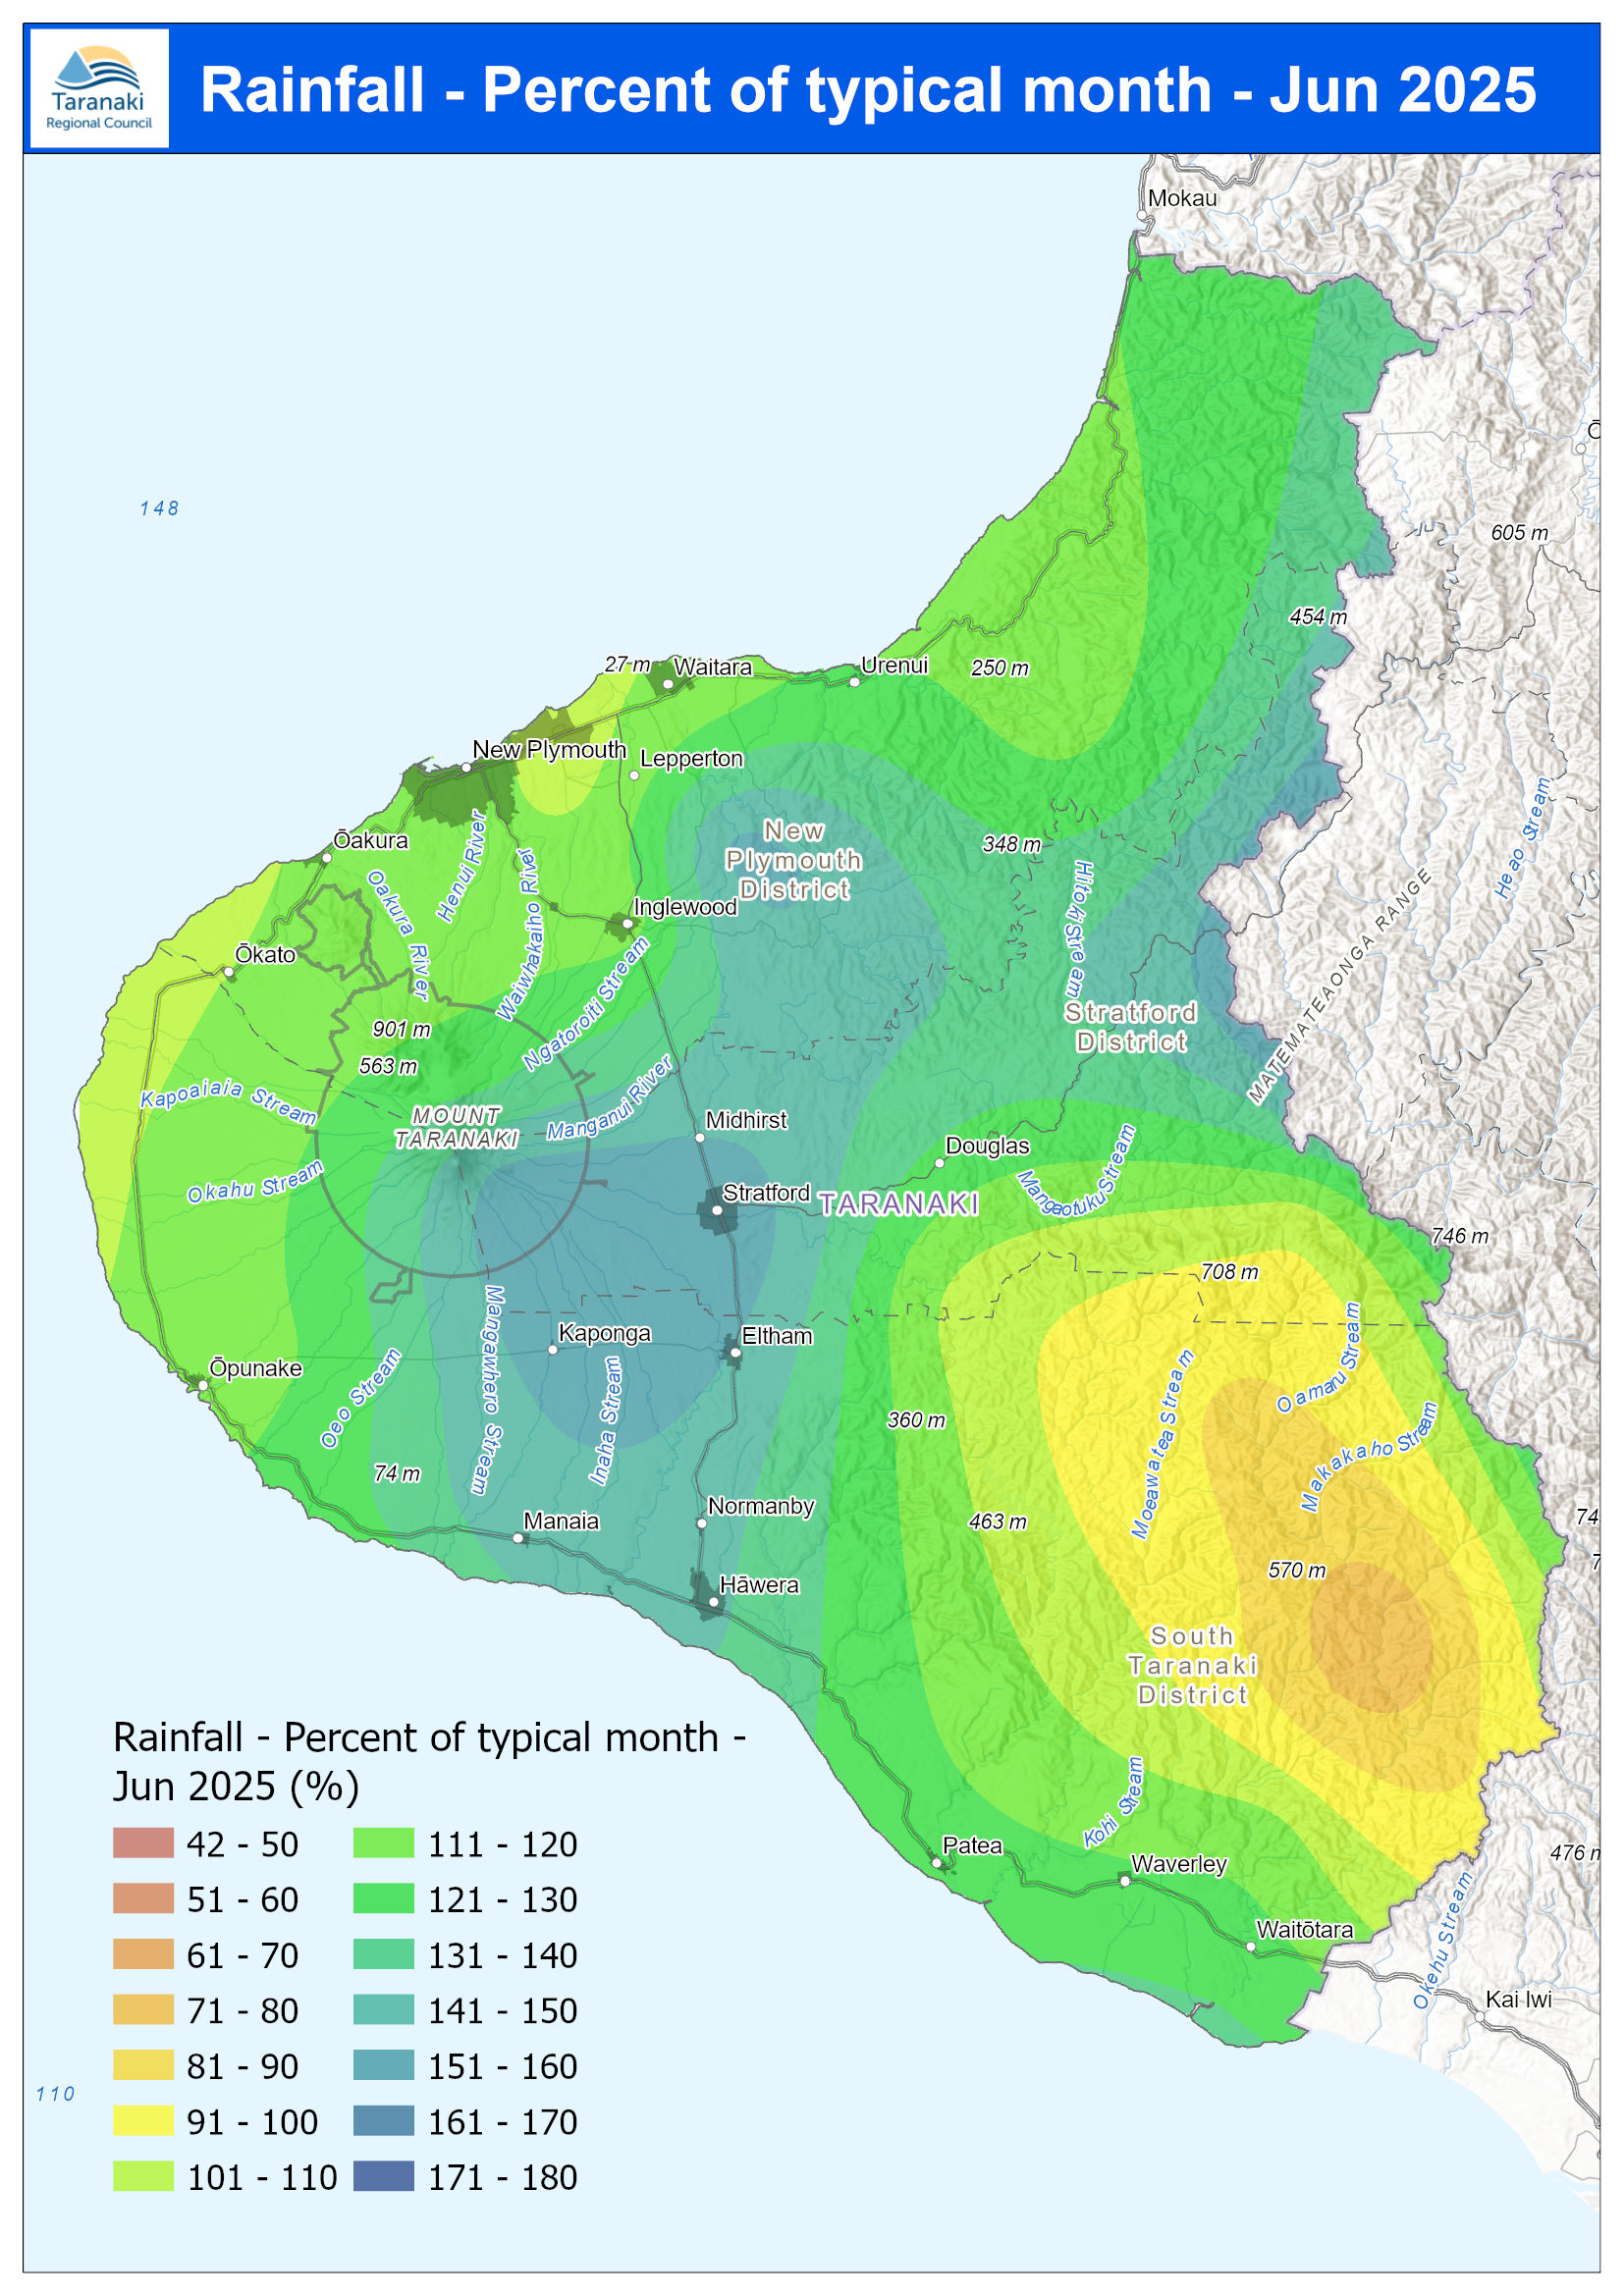
June 2025 Rainfall % of typical month
TRC Bulletin - November 2018
Government-imposed swimmability target, which Taranaki and other regions with similar rainfall patterns cannot expect to meet. The Policy & Planning Committee was told that according to modelling projections, 39% of the region’s rivers and 97% of lakes currently meet national criteria, compared with the Government’s target of 80% compliance in each category by 2030. The modelling suggests that riparian fencing and planting, and the switch to land-based disposal of dairy effluent, will boost Taranaki’s river