Your search for 'rainfall' returned 1425 results.
January rainfall maps
page STRATFORD WAITARA Provisional data only PATEA NEW PLYMOUTH OPUNAKE ELTHAM MANAIA HAWERA EGMONT NATIONAL PARK Total monthly rainfall (mm) KEY xxx yy% INGLEWOOD Pohokura Saddle Dawson Falls Cape Egmont Stratford Whareroa Patea North Egmont Inglewood Motunui Brooklands Kaka Rd Kotare Rimunui Glenn Rd Huinga 47% 36% 37% 23% 15% 18%11% 28% 15% 21% 22% 30% 33 68 52
Monthly Rainfall Norms
Monthly rainfall norms at monitored Taranaki sites.
Waitōtara Catchment Flood Study - Draft Calibration Report
4.2.2 Flows 28 4.2.3 Discharge Volume 30 4.2.4 Timing of Peak 31 4.2.5 Summary 32 5 CONCLUSIONS AND RECOMMENDATIONS 34 LIST OF FIGURES Figure 2-1 Waitōtara Catchment 6 Figure 3-1 Waitōtara Gauge Summary Map 9 Figure 3-2 Cumulative Hourly Rainfall Depths at Gauges – June 2015 10 Figure 3-3 Gauge Data for Hydraulic Model Calibration – June 2015 11 Figure 3-4 Tidal Boundary Conditions – June 2015 11 Figure 3-5 Cumulative Hourly Rainfall Depths at Gauges –
November 2024 Rainfall of typical month
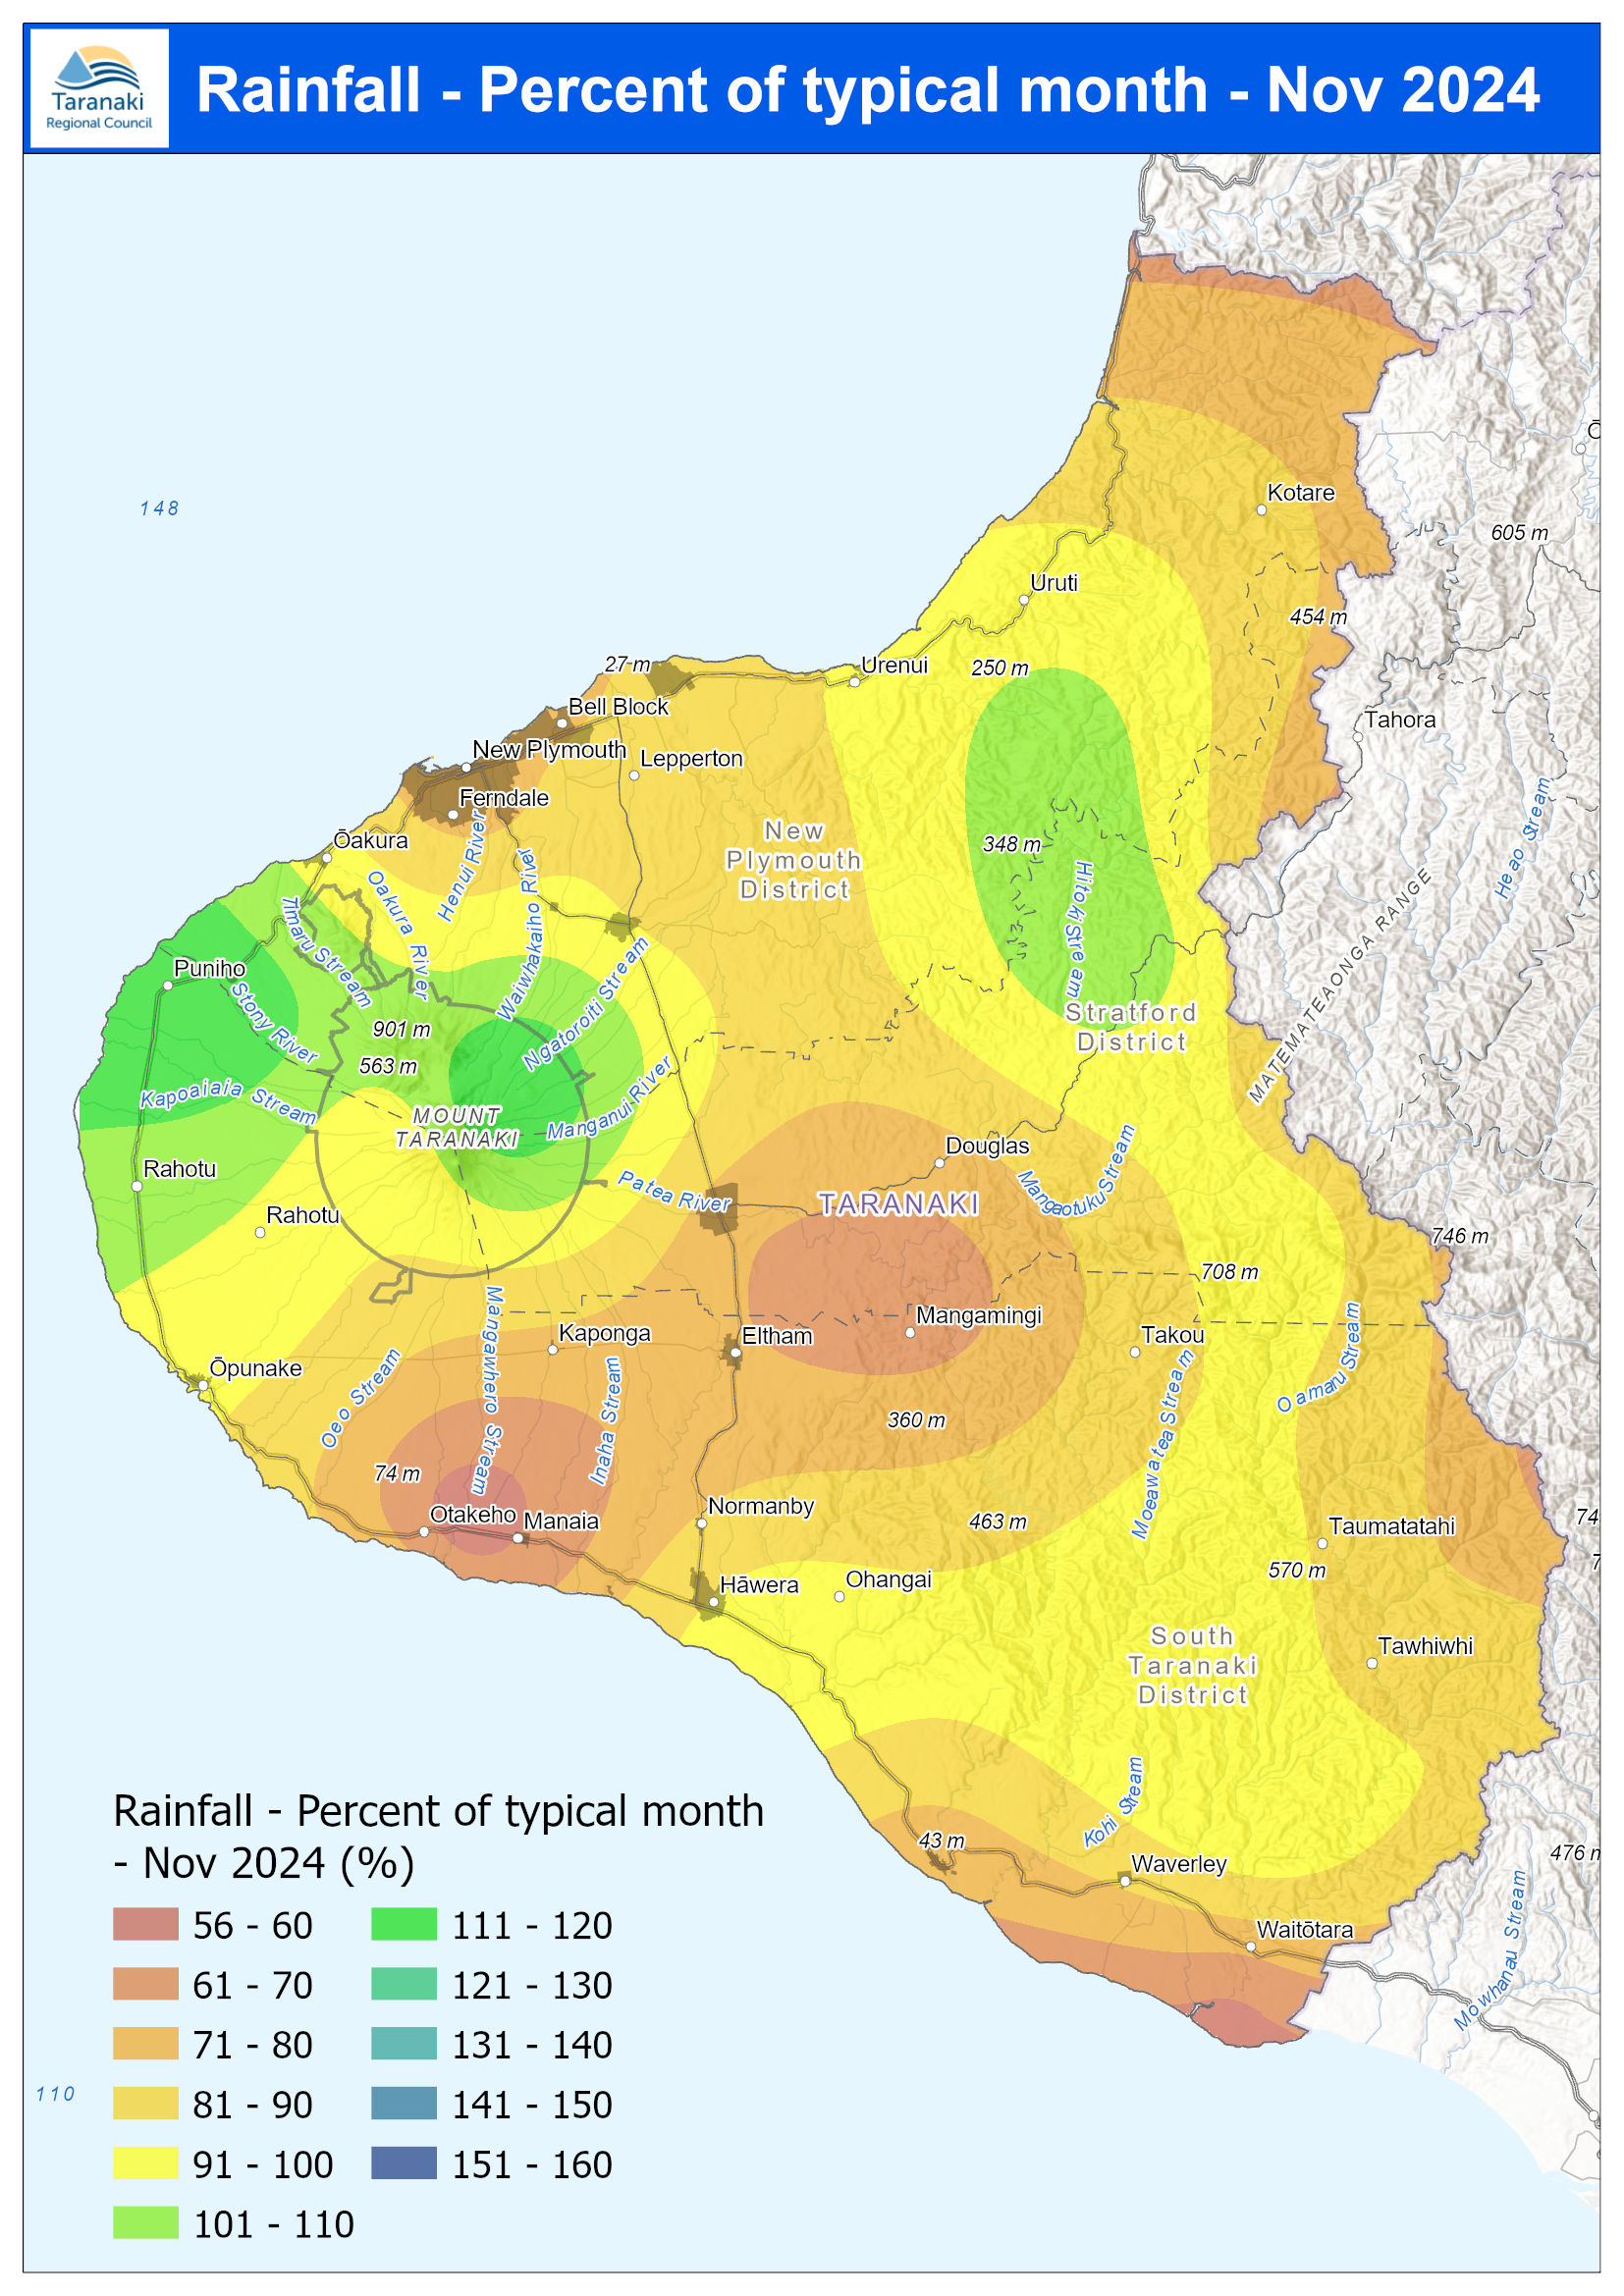
November 2024 Rainfall January to November
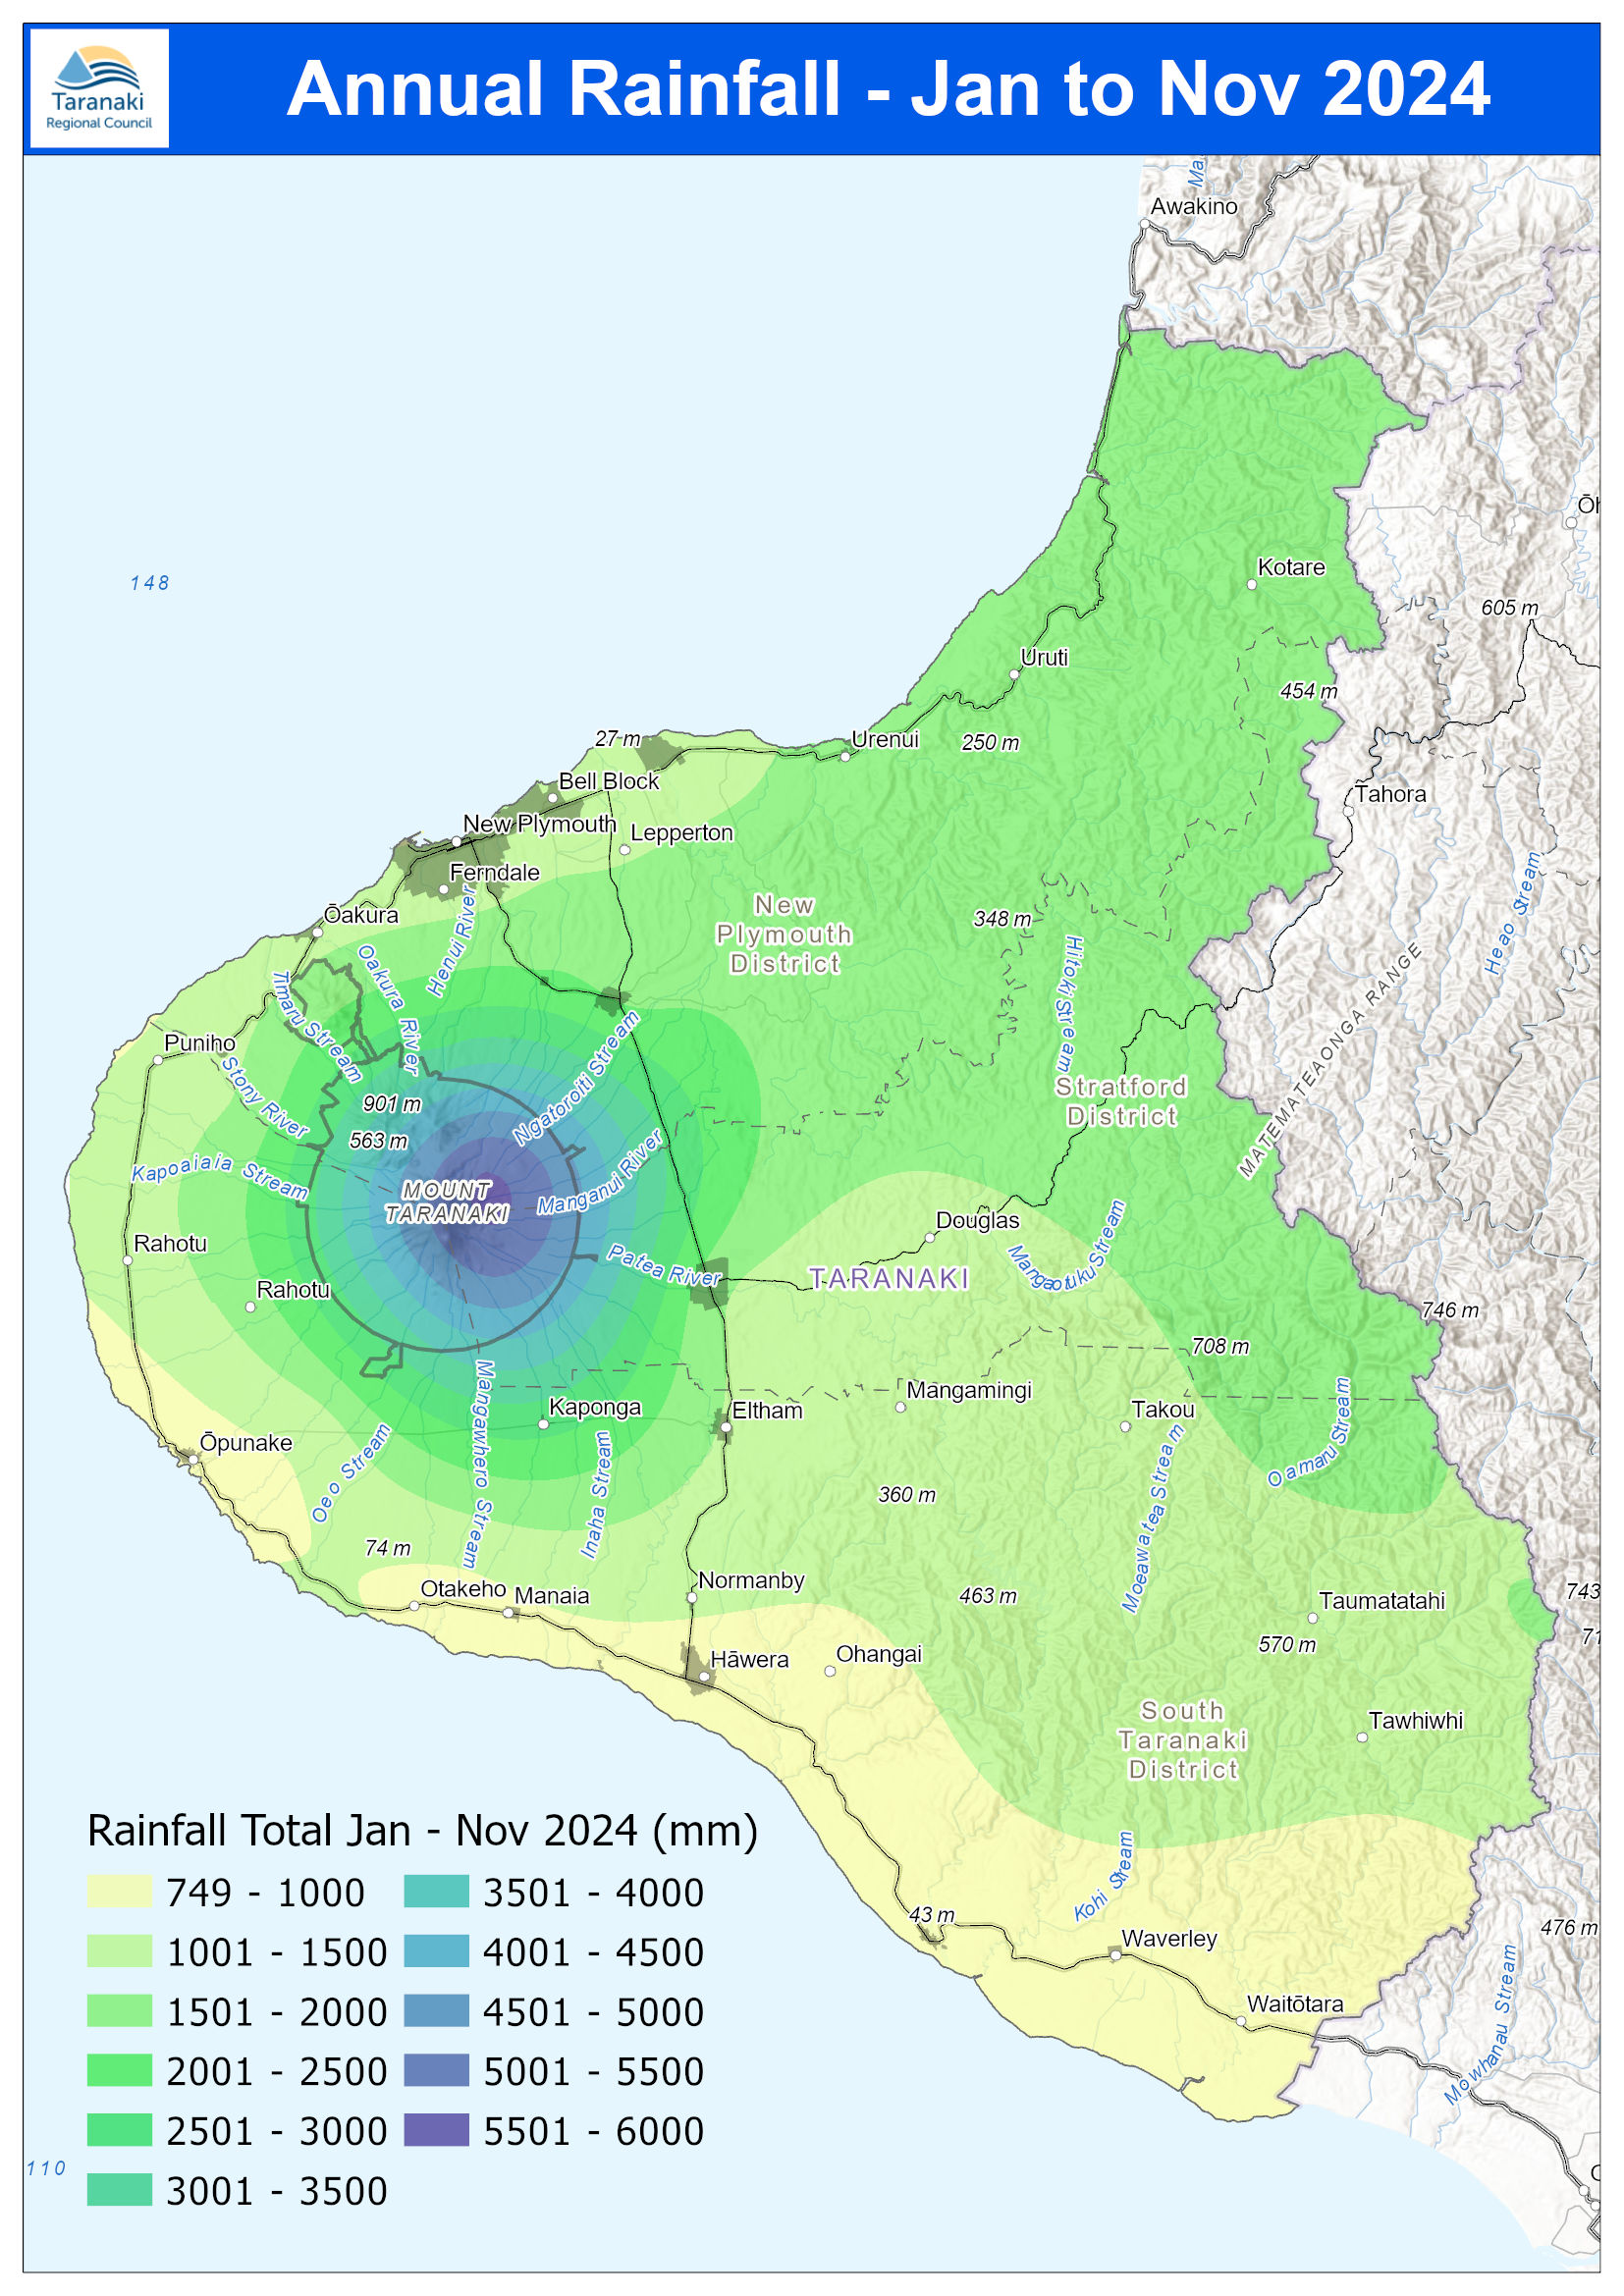
February 2025 Rainfall % of typical month
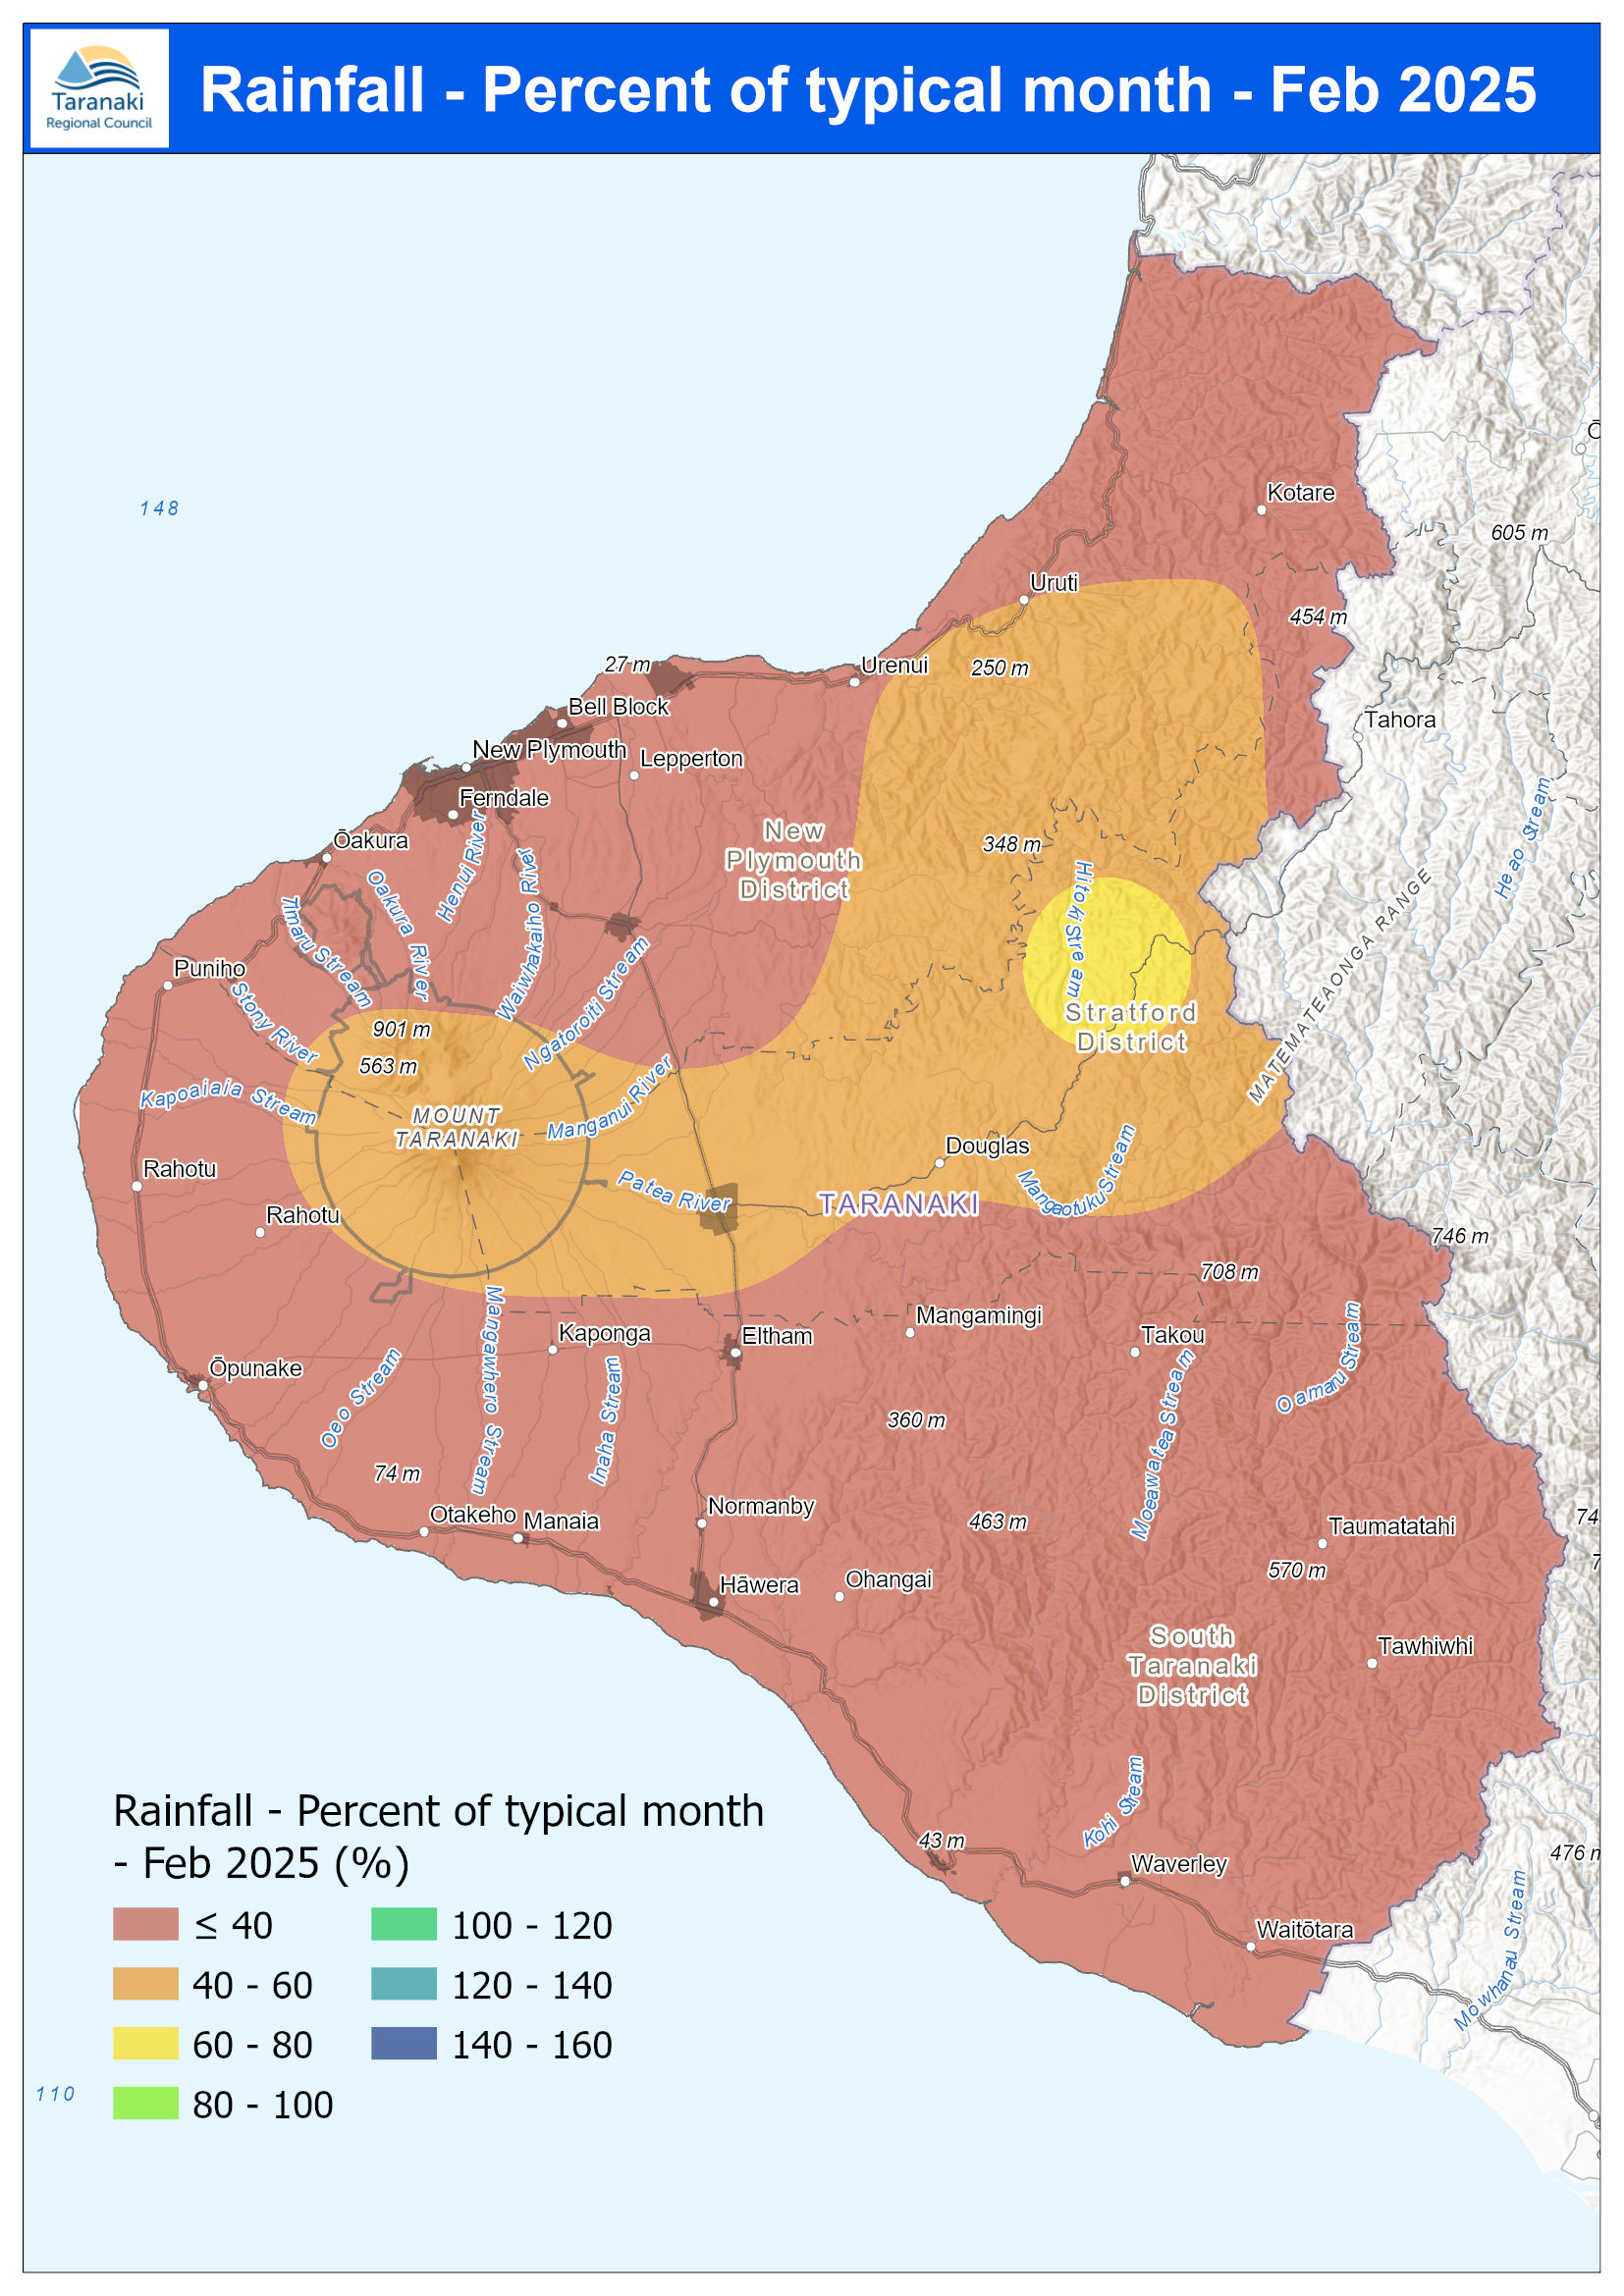
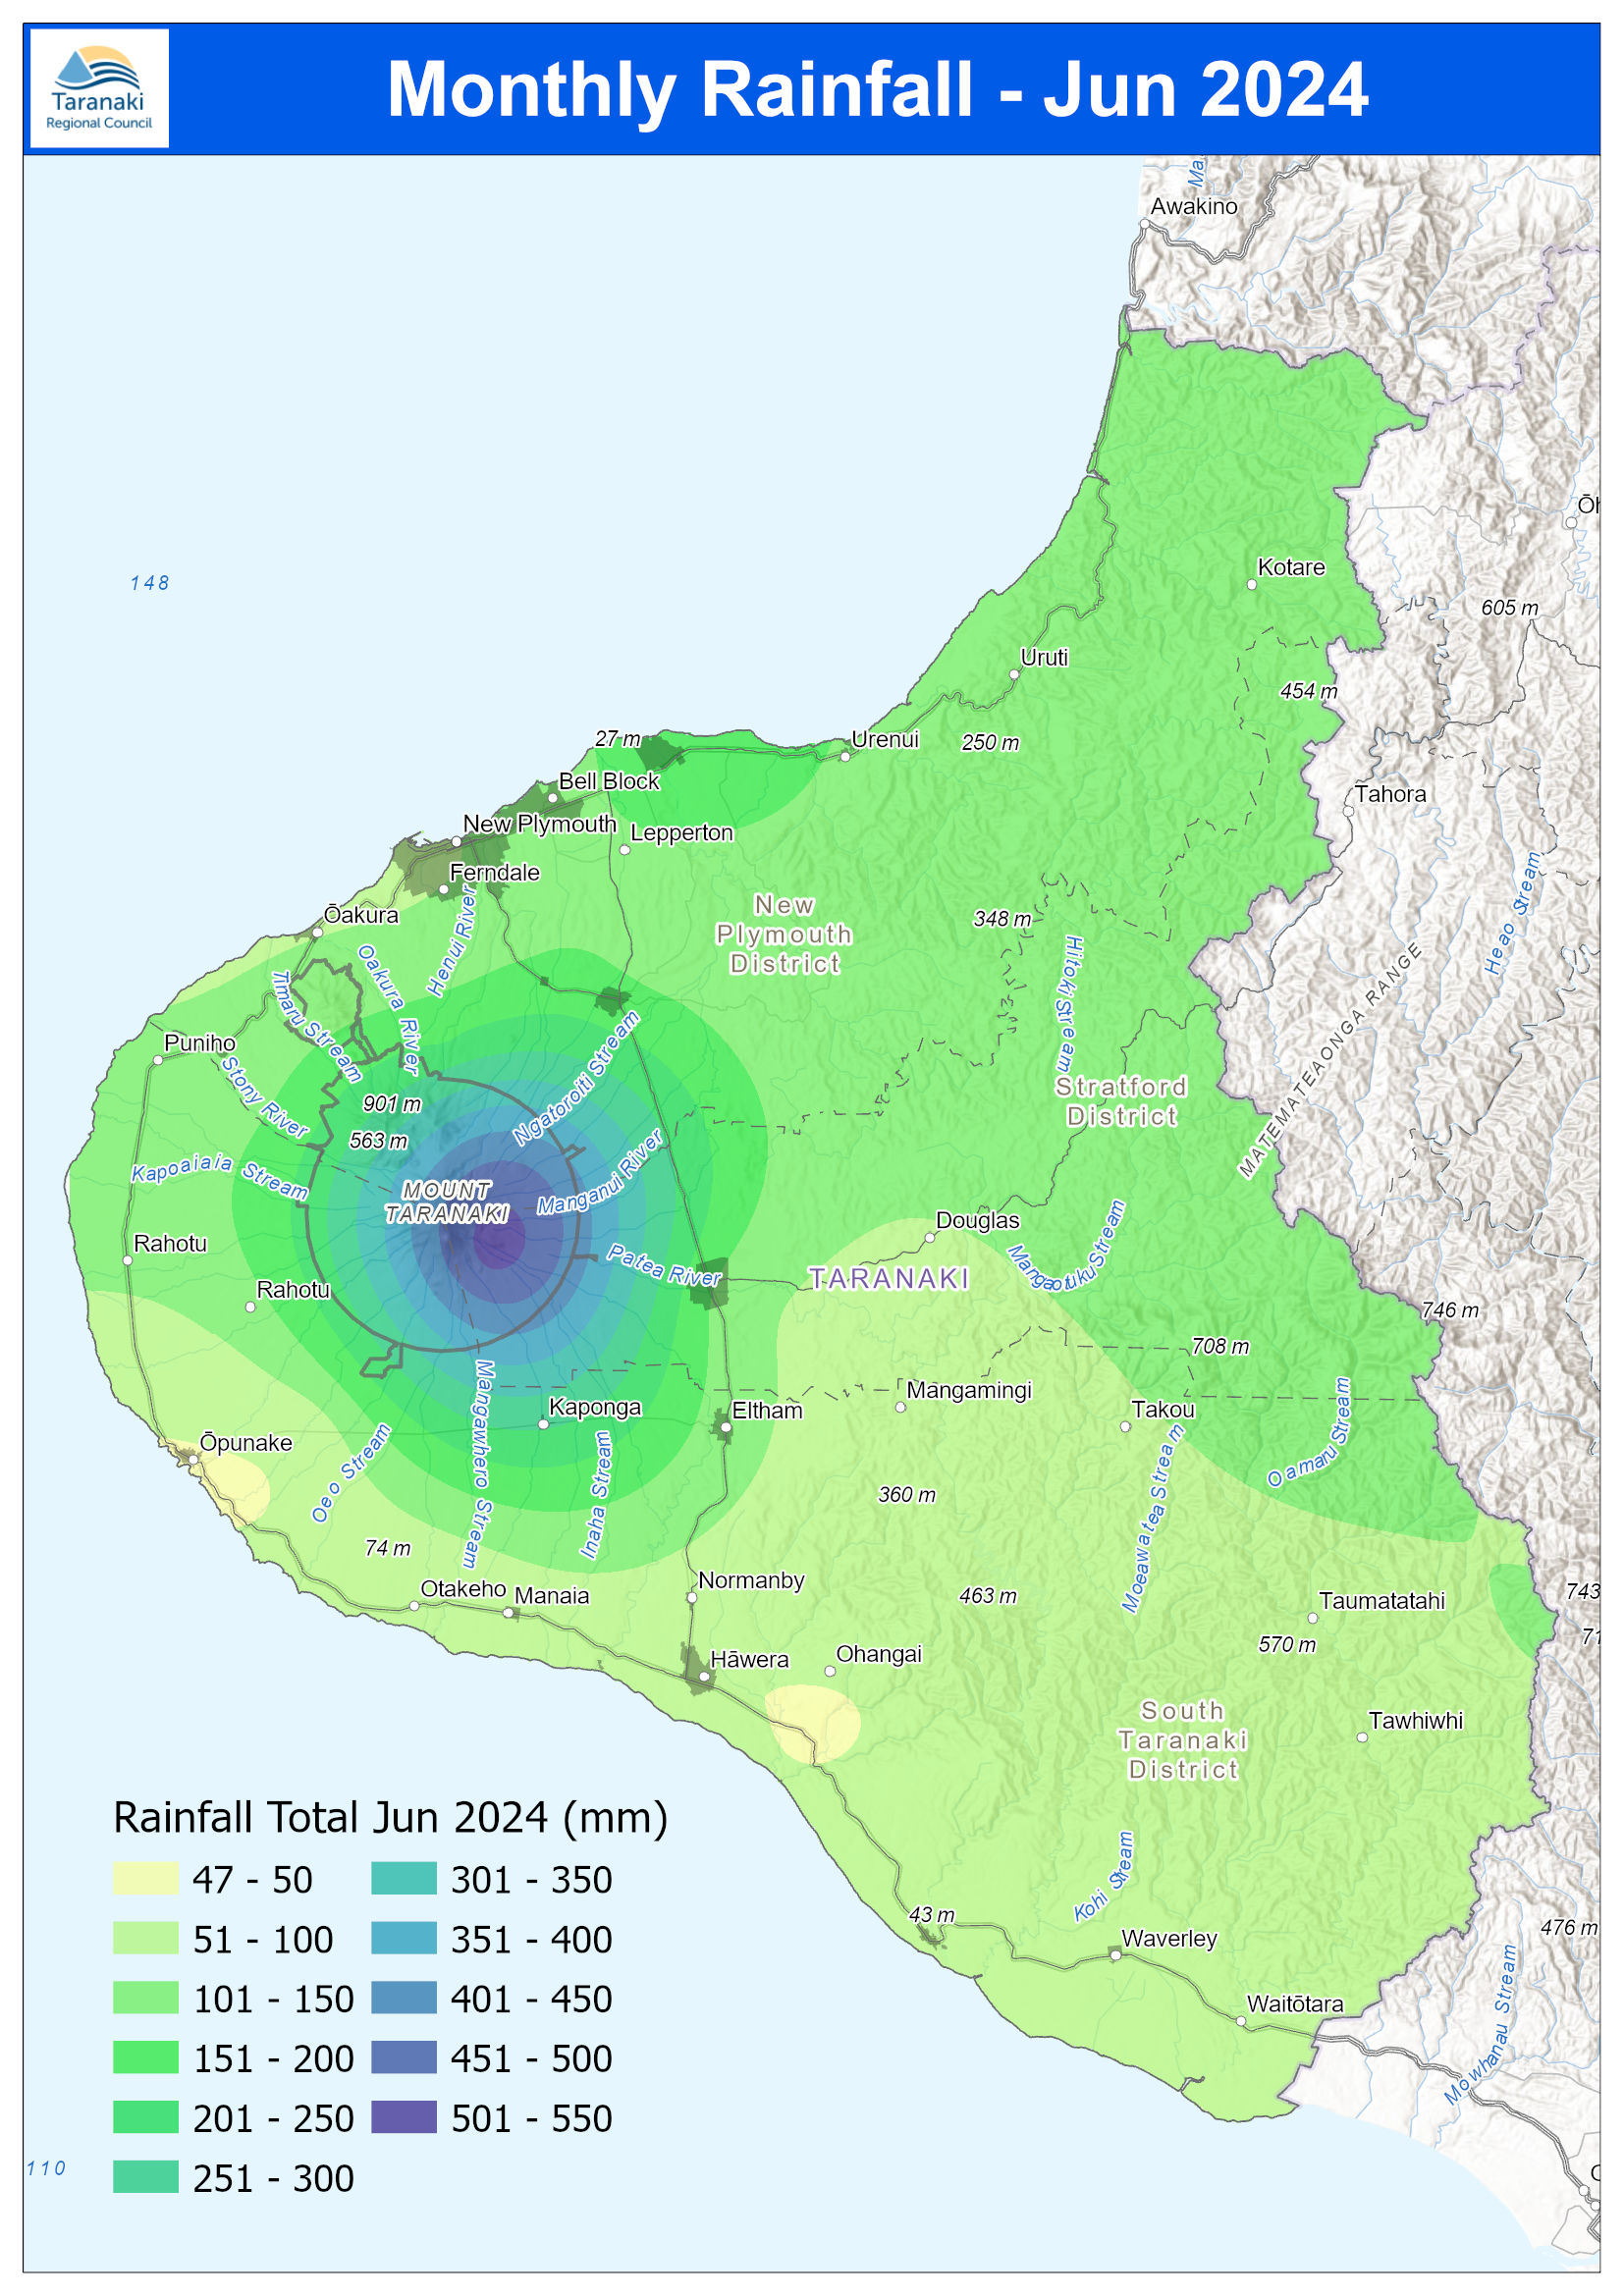
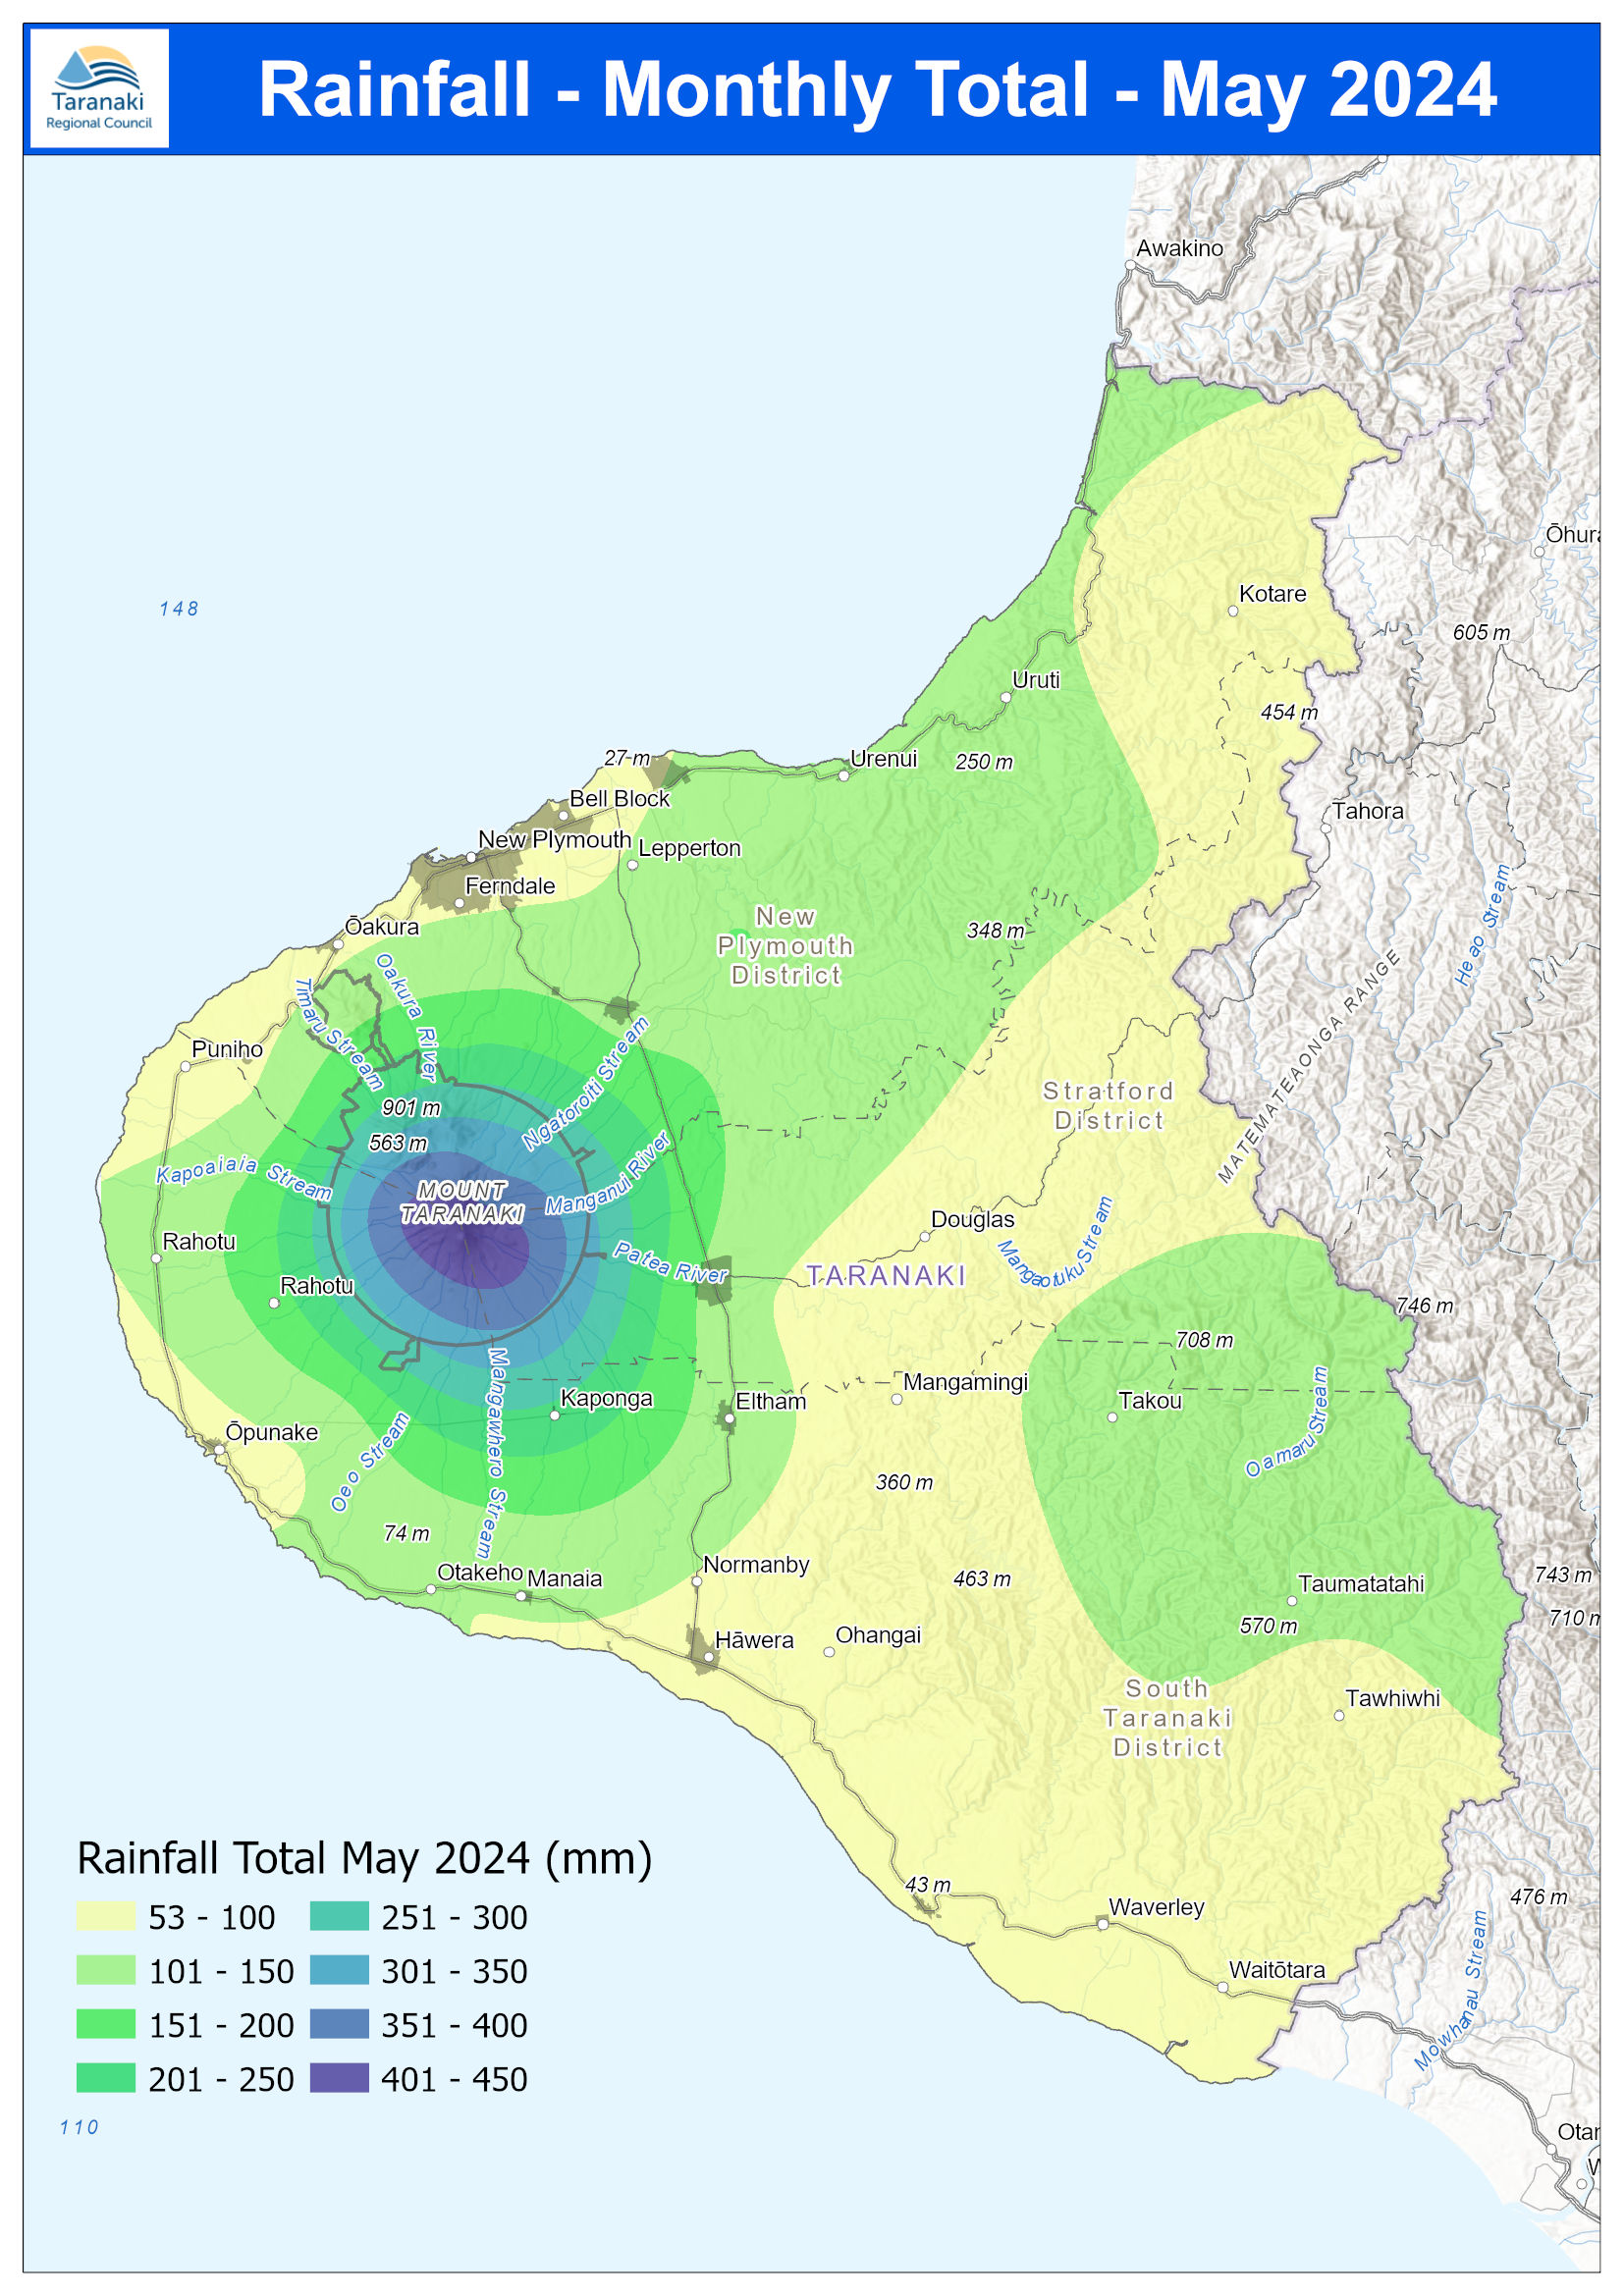
May 2024 Rainfall monthly total
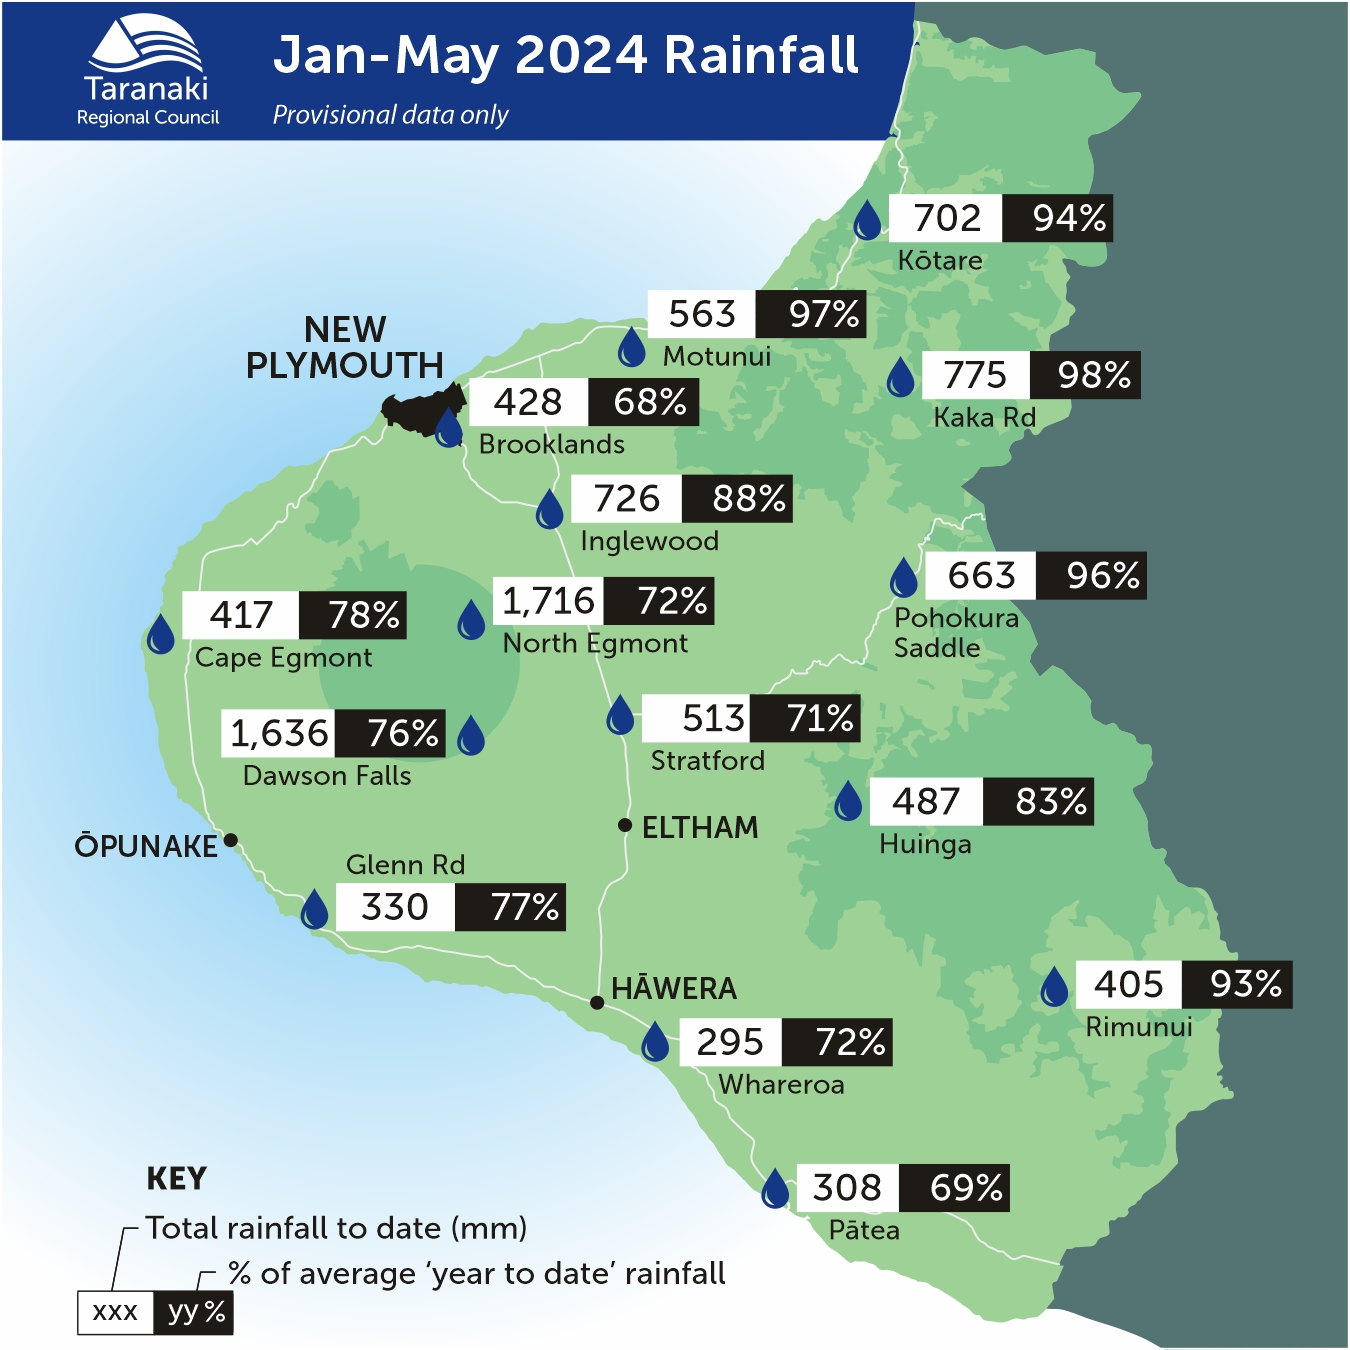
Jan to May 2024 rainfall
Jan to May 2024 rainfall
page Provisional data only Total rainfall (mm)to date xxx yy% KEY % of average ‘year to date’ rainfall xxx yy % NEW PLYMOUTH H WERAĀ ELTHAM Kaka Rd P teaā K tareō Motunui Brooklands Inglewood Pohokura SaddleNorth Egmont Stratford Huinga Cape Egmont Dawson Falls Glenn Rd Whareroa Rimunui Jan-May 4220 Rainfall 94%702 98%775 97%563 68%428 88%726 96%663 7 %21,716 71%513 83%487 78%417 76%1,636 7